I’m waiting for a tramline break that will shock the bears
Tramlines are invaluable when it comes to spotting upcoming changes in market direction, says John C Burford.
Get the latest financial news, insights and expert analysis from our award-winning MoneyWeek team, to help you understand what really matters when it comes to your finances.
You are now subscribed
Your newsletter sign-up was successful
Want to add more newsletters?

Twice daily
MoneyWeek
Get the latest financial news, insights and expert analysis from our award-winning MoneyWeek team, to help you understand what really matters when it comes to your finances.

Four times a week
Look After My Bills
Sign up to our free money-saving newsletter, filled with the latest news and expert advice to help you find the best tips and deals for managing your bills. Start saving today!
The counter-trend stock rally I flagged came and went almost in a blink! Last night, stocks rallied sharply and this morning are back down to earth. I did warn that this bear market will see sharp, but brief rallies and this was one of them.
But yesterday morning the signs were pointing to a rally immediately ahead.
So today I will lay out how I go about analysing a highly active market, and how I try to spot trends before they happen using my tramline methods.
MoneyWeek
Subscribe to MoneyWeek today and get your first six magazine issues absolutely FREE

Sign up to Money Morning
Don't miss the latest investment and personal finances news, market analysis, plus money-saving tips with our free twice-daily newsletter
Don't miss the latest investment and personal finances news, market analysis, plus money-saving tips with our free twice-daily newsletter
This was the 15-minute Dow chart I captured yesterday morning:
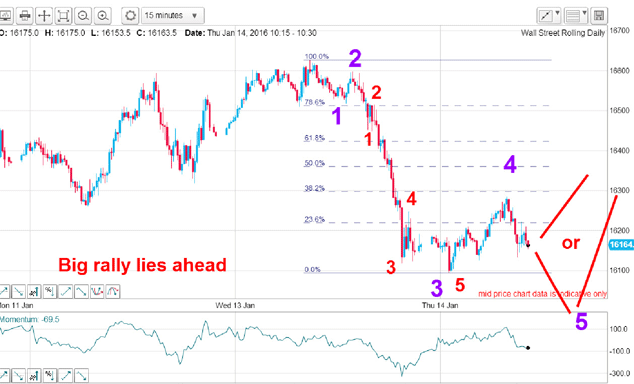
I had two alternative paths either an immediate rally in a purple wave 4 extension, or a new low in purple wave 5 before a sharp rally. And this is what happened:
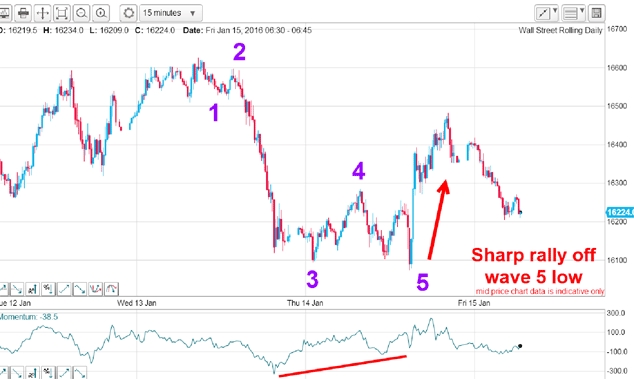
In fact, the market made a new low in wave 5 just under the wave 3 low to complete the five down. That occurred late yesterday. Remember, fifth waves are terminating waves on all time scales and herald a counter-trend move, usually in an A-B-C form. The key is to identify where wave 5 ends (often a very tricky task!).
Then, with the huge momentum divergence which indicated selling pressure was drying up, the market was poised to scream higher. In fact, the Dow climbed by 300 points within half an hour and took out the stop loss buy orders just above my wave 4 high in a mini short squeeze.
This rate of ascent was steeper than any of the declines and could forewarn of further sharp advances.
So has the bear taken control again this morning after that brief flurry? After all, the main trend remains firmly down.
Here are my tramlines on the hourly chart:
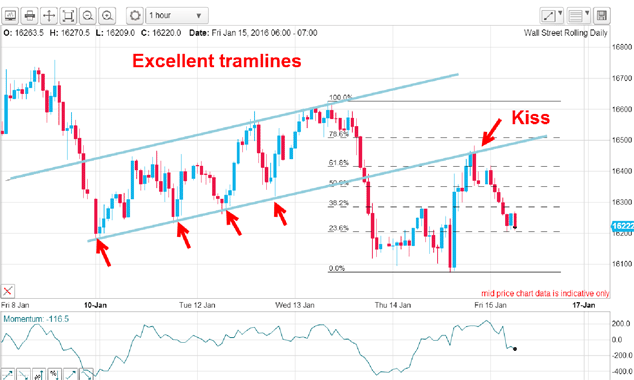
My lower tramline has four accurate touch points, making it highly reliable as a line of support and of resistance (following the break). And just to prove how good that resistance line is, the sharp rally was stopped bang on that line in a traditional kiss.
And that point was also in the region of the Fibonacci 62% resistance, which is another area of resistance.
So what is the immediate outlook for a swing trader? After all, we have a complete five down to yesterday's low, which implies a decent bounce in an A-B-C form. If you examine the above chart (current as I write), we have a potential A wave and the market is declining this morning in what could be a B wave. So, does a C wave lie up ahead? If so, the rally could be just as sharp as in Wave A and possibly extend to the blue tramline in another kiss.
If this happens, there is a 300-pip profit available. So how to play it?
Let's take a closer look. Here is the 15-minute chart as I write (at 8:15 am):
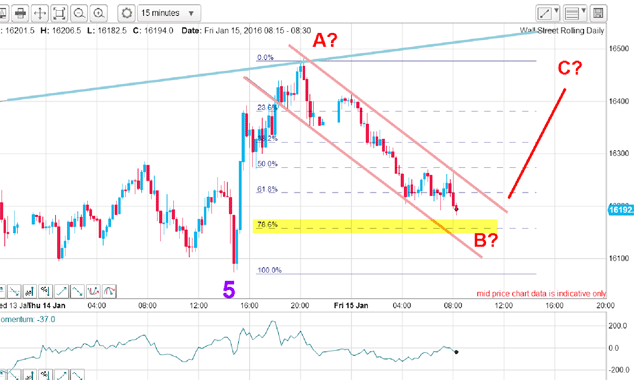
The market is approaching the last line of support at the Fibonacci 78% level. If there is to be a C wave rally, odds are that it would start from around there, or perhaps from the lower tramline (which lies somewhat below the Fibonacci 78% support).
Note the excellent tramlines in my B wave with accurate touch points all round.
Using my tramline rule, a break above the upper line would indicate further strength and that is the place to enter a buy order to test my C wave theory. Unless it does, then doing nothing (and staying short) is the best policy.
Also note the pattern within the B wave there is a mini five down.
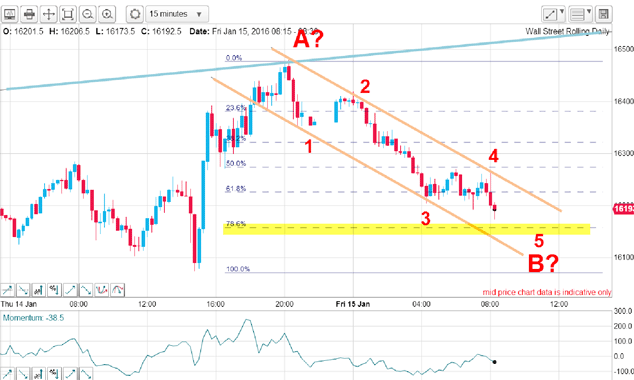
Wave 5 has not yet completed and it could do that if it enters the Fibonacci 78% support zone or above.
The key to a reversal up is an upper tramline break. That is my signal.
I remain with a short position and would treat any long trade as a separate trade.
Mediasentiment remains solidly bearish here is a selection of headlines in yesterday's Daily Telegraph:
"Here are the three biggest threats to the world right now."
"BHP Billiton announces $7 billion writedown amid oil and gas slump."
"European shares close at 12-month low on oil price slide."
"Fears of emissions scandal at Renault wipes 5 billion euros off shares."
"Spike in UK companies suffering 'significant' financial distress."
But it is the unprecedented RBS 'sell everything' advice that still sticks in my mind as a defining mark of this week's utter despair among investors.
Get the latest financial news, insights and expert analysis from our award-winning MoneyWeek team, to help you understand what really matters when it comes to your finances.
John is is a British-born lapsed PhD physicist, who previously worked for Nasa on the Mars exploration team. He is a former commodity trading advisor with the US Commodities Futures Trading Commission, and worked in a boutique futures house in California in the 1980s.
He was a partner in one of the first futures newsletter advisory services, based in Washington DC, specialising in pork bellies and currencies. John is primarily a chart-reading trader, having cut his trading teeth in the days before PCs.
As well as his work in the financial world, he has launched, run and sold several 'real' businesses producing 'real' products.
-
 ISA fund and trust picks for every type of investor – which could work for you?
Whether you’re an ISA investor seeking reliable returns, looking to add a bit more risk to your portfolio or are new to investing, MoneyWeek asked the experts for funds and investment trusts you could consider in 2026
-
 The most popular fund sectors of 2025 as investor outflows continue
It was another difficult year for fund inflows but there are signs that investors are returning to the financial markets