I called the euro’s plunge more than a week ago
The recent fall in the euro will have taken many by surprise, says John C Burford. But the warnings were in the charts for all to see.
Get the latest financial news, insights and expert analysis from our award-winning MoneyWeek team, to help you understand what really matters when it comes to your finances.
You are now subscribed
Your newsletter sign-up was successful
Want to add more newsletters?

Twice daily
MoneyWeek
Get the latest financial news, insights and expert analysis from our award-winning MoneyWeek team, to help you understand what really matters when it comes to your finances.

Four times a week
Look After My Bills
Sign up to our free money-saving newsletter, filled with the latest news and expert advice to help you find the best tips and deals for managing your bills. Start saving today!
On Wednesday, I showed how I am using my split-bet strategyin my current USD/CAD campaign. I'm also using that strategy to great effect it in my EUR/USD trading and today I will show you exactly how I'm doing it.
Yesterday, the euro hit the headlines as it plummeted following Draghi's hint that the European Central Bank (ECB) will likely extend and/or increase the level of its current quantitative easing (QE) operations. The central bank is attempting to lower the euro's trade weighted value in order to stimulate exports and get GDP growth up off the floor. Whether it will work is an open question.
Having a lower exchange rate does not necessarily lead to greater exports history has proven that many times. What the ECB should actually do is introduce policies that directly impact the production of goods and services the world needs at the prices it is willing to pay. But I digress from my task of covering how to take profits from misguided ECB policies.
MoneyWeek
Subscribe to MoneyWeek today and get your first six magazine issues absolutely FREE

Sign up to Money Morning
Don't miss the latest investment and personal finances news, market analysis, plus money-saving tips with our free twice-daily newsletter
Don't miss the latest investment and personal finances news, market analysis, plus money-saving tips with our free twice-daily newsletter
How I learned to avoid trading heartbreak
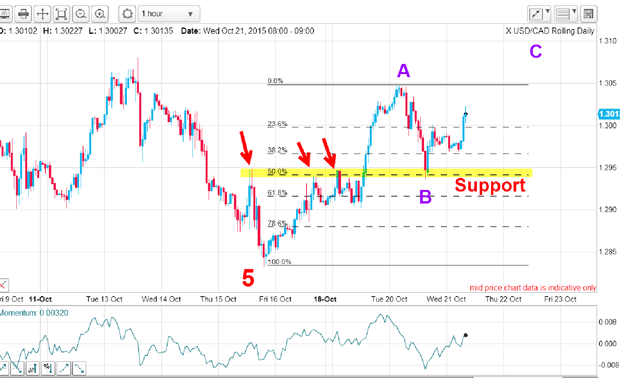
Remember, this is a technique I use to capture part profit when I believe the market has reached a temporary extreme. I banked that profit and left the other part open before raising my protective stop to break even.
That way, whatever happens, I am guaranteed at least some profit. If the market reverses and declines past my original entry (my worst case scenario), I can walk away with a profit for my efforts and that is a very satisfying position to be in.
When I started out trading, I was making the very common mistake of getting into a good trade, seeing my paper profits increase, and then watching helplessly when the market suddenly reversed course and took me out at my original stop for a loss. Giving back those profits was devastating I was determined to find a solution.
Naturally, when a trade goes bad from the off, nothing can be done (except using my 3% rule to limit that loss, of course).
Below is the updated hourly chart. Yesterday, the market as I expected moved up sharply to the Fibonacci 50% level, but there is not a momentum divergence present. And that observation has now cast some doubt on my A-B-C labels. In fact, under an alternative scenario, the market could be gearing up for a five wave advance where my C wave is the start of the third wave up:
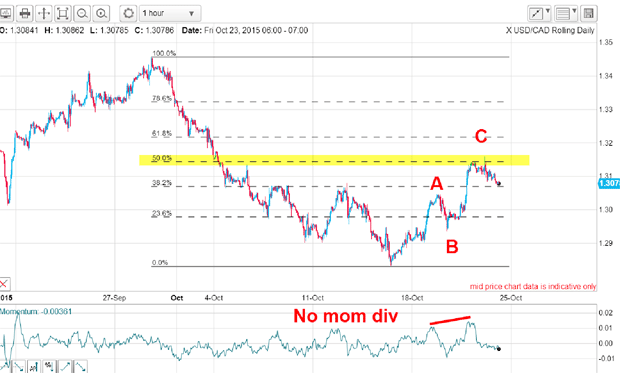
In any case, because the Fibonacci 50% level almost always represents solid resistance (at least temporarily), I decided to take partial profits there and with my part position open, I will be examining the form of the decline for clues as to the direction the market wishes to take from here.
So far, my campaign has landed me two banked profits and I have a winning open position working with stops at break even.
I foretold yesterday's euro plunge
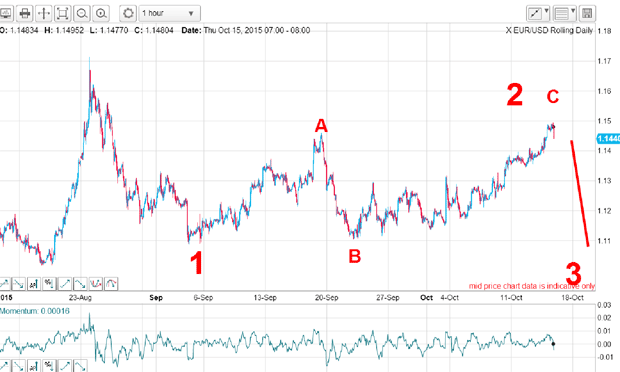
The August high above 1.16 was the top of the rally and the waves since then are marked. The first big wave was my wave 1 of a large five down and this wave also sports a nice five down form with momentum divergence at the low. And the relief wave 2 rally was a large A-B-C in textbook form. I was therefore looking for a very large move down in wave 3. That was the roadmap I laid out for the next few weeks/months.
So on 15 October, I believed the market was teed up nicely for a short trade and I duly obliged with a short entry above 1.1450.
The market initially moved impulsively down to purple wave 1 off the 115 high to help confirm my wave 3 scenario. After a feeble wave 2 rally, the market collapsed by over two cents yesterday in another confirmation of the long and strong wave 3 down.
This is the updated hourly chart:
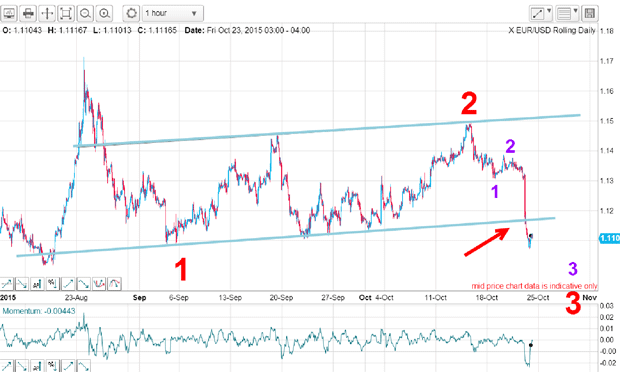
Now I have two third waves working and this is a most powerful setup. I can firm up some lower targets especially now that my lower blue tramline has been breached.
Below is the current daily chart. I have an excellent tramline pair working and this morning, the market has hit the lower tramline, which is also the area of the Fibonacci 50% level. The area surrounding the current 1.1100 level is therefore strong support and is my first major target.
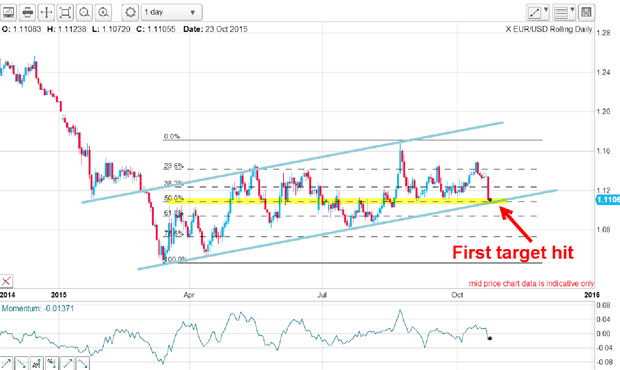
That target is where I have just taken partial profits. My original entry was 1.1450, so I've made a profit of 350 pips. I retain part of my short position and have moved protective stops to break even.
The euro story is getting exciting now andit is offering swing traders tremendous setups.
Get the latest financial news, insights and expert analysis from our award-winning MoneyWeek team, to help you understand what really matters when it comes to your finances.
John is is a British-born lapsed PhD physicist, who previously worked for Nasa on the Mars exploration team. He is a former commodity trading advisor with the US Commodities Futures Trading Commission, and worked in a boutique futures house in California in the 1980s.
He was a partner in one of the first futures newsletter advisory services, based in Washington DC, specialising in pork bellies and currencies. John is primarily a chart-reading trader, having cut his trading teeth in the days before PCs.
As well as his work in the financial world, he has launched, run and sold several 'real' businesses producing 'real' products.
-
 Average UK house price reaches £300,000 for first time, Halifax says
While the average house price has topped £300k, regional disparities still remain, Halifax finds.
-
 Barings Emerging Europe trust bounces back from Russia woes
Barings Emerging Europe trust has added the Middle East and Africa to its mandate, delivering a strong recovery, says Max King