How to trade the volatile pound / dollar market
When one method doesn't give you the accuracy you need to trade a spiky market, this curious trait of Elliott waves can prove valuable.
Get the latest financial news, insights and expert analysis from our award-winning MoneyWeek team, to help you understand what really matters when it comes to your finances.
You are now subscribed
Your newsletter sign-up was successful
Want to add more newsletters?

Twice daily
MoneyWeek
Get the latest financial news, insights and expert analysis from our award-winning MoneyWeek team, to help you understand what really matters when it comes to your finances.

Four times a week
Look After My Bills
Sign up to our free money-saving newsletter, filled with the latest news and expert advice to help you find the best tips and deals for managing your bills. Start saving today!
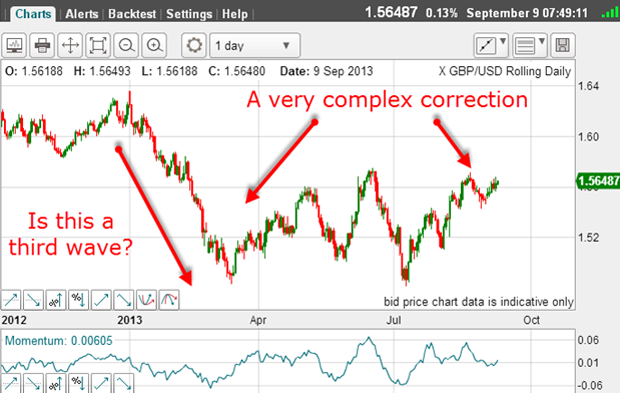
The GBP/USD has been volatile this year and very difficult to trade. In fact, I have only traded it a few times in the past few months.
And gazing at the daily chart since late last year, it is easy to see how you could have been whipsawed to death by selling weakness rather than selling into strength or buying into weakness.

Let's try to analyse where we are in the Elliott wave picture.
MoneyWeek
Subscribe to MoneyWeek today and get your first six magazine issues absolutely FREE

Sign up to Money Morning
Don't miss the latest investment and personal finances news, market analysis, plus money-saving tips with our free twice-daily newsletter
Don't miss the latest investment and personal finances news, market analysis, plus money-saving tips with our free twice-daily newsletter
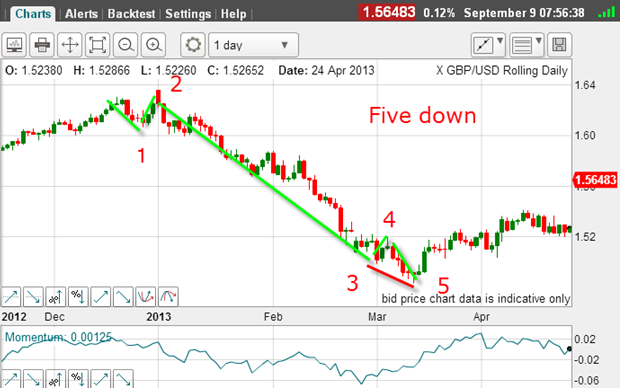
The big move down from the January top a move of some 16 cents confirms the long-term trend remained down.
The January top is a little tricky, but if I say I can count waves 1 and 2 up there, the bulk of the decline is wave 3, since it is long and strong.
And the final poke down can be counted as waves 4 and 5. Here are my labels:

With the clear positive-momentum divergence at the low (red bar), this confirms the count.
After a five-wave move, we should expect a counter-trend move, hopefully in an A-B-C form. This five down also confirms the main trend is down and after the corrective moves have completed, we should see new lows.
That is the clear Elliott wave picture.
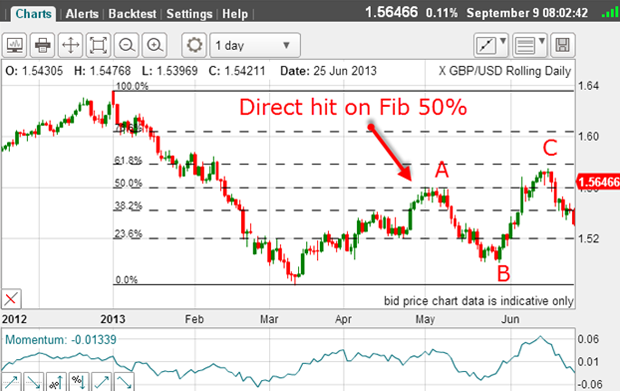
But does the correction off the March low have an A-B-C form?

As of late June, it seems to have the classic form!
I have wave A topping bang on the Fibonacci 50% retrace, a nice B wave down, and then a new high for the C wave which just stops short of the Fibonacci 62% retrace.
Now, this miss on the 62% level may have bothered some traders especially if they were patiently waiting there to short the market and then looked on in dismay as the market moved against them.
I'm afraid this is a fate often suffered by those who use exact Fibonacci levels to guide their trades!
But is there another method to judge the likely height of the C wave?
The wave equality rule
One of the most common wave relationships in Elliott wave theory is the wave equality rule between the A and C waves.
This rule states that often, the A and the C waves will have equal heights in price.
So let's apply this rule to these waves.
Measuring the difference in price levels between the A wave top and the recent low at 1.4830, I get a price difference of 774 pips.
Taking the B wave low at 1.5007 and adding 774 pips, we get a target of 1.5780 for the C wave top.
This level of 1.5780 is within pips of matching the Fibonacci 62% retrace!
Isn't that pretty?
So, two independent methods have given 1.5780 as the target for the C wave top.
The actual top was 1.5750 30 pips shy. But in the spiky market that is GBP/USD, that is not bad at all.
I consider that a hit.
Setting your C wave top
After all, I am looking for a C wave top and hoping to join the market in the direction of the main trend. The rewards are likely to be high.
As it turned out, the market turned just before the target and moved swiftly lower, confirming the downtrend had resumed. The market broke below the B wave low on 5 July and was a signal the downtrend would likely continue.
But then, in early July, the market turned and rallied back above the B wave low. This was a signal that the plan had changed and that the downtrend theory was wrong at least for now.
That was a signal to cover all shorts.
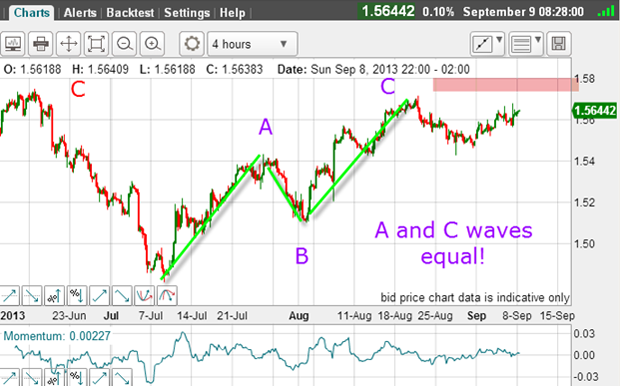
But the rally off this low also has an A-B-C form:

And what is startling is this the A and C waves are equal in height within a couple of pips!
So what does this mean?
Simply that when the C wave was taking shape, you could have used the equality rule to set your target for the C wave top. You had days to do this in advance!
Now that's what I call priceless information.
So the situation is this: the C wave top has not exceeded the previous C wave top, thereby confirming that latter C wave as the likely top of the entire relief rally.
But there is a little room above this to the Fibonacci 62% level at 1.5780 (pink zone) which would still mean the relief rally was near an end and no new bull market was taking shape.
And this morning, the market is hovering near the new C wave high.
The key to the next move is this: if the market can break below the 1.54 level where there is a minor low, that should result in further moves down in the near term.
But if the market pushes above the 1.5780 area, all bets are off and a much more complex wave pattern is unfolding.
But so far, the A and C waves have provided vital clues as to how to trade in this very tricky period.
Of course, all eyes will be on next week's Fed pronouncements and the US dollar will take centre stage. But with the Elliott waves indicating GBP/USD is in a long-term downtrend, any bullish reaction should be reversed.
Get the latest financial news, insights and expert analysis from our award-winning MoneyWeek team, to help you understand what really matters when it comes to your finances.
John is is a British-born lapsed PhD physicist, who previously worked for Nasa on the Mars exploration team. He is a former commodity trading advisor with the US Commodities Futures Trading Commission, and worked in a boutique futures house in California in the 1980s.
He was a partner in one of the first futures newsletter advisory services, based in Washington DC, specialising in pork bellies and currencies. John is primarily a chart-reading trader, having cut his trading teeth in the days before PCs.
As well as his work in the financial world, he has launched, run and sold several 'real' businesses producing 'real' products.
-
 ISA fund and trust picks for every type of investor – which could work for you?
Whether you’re an ISA investor seeking reliable returns, looking to add a bit more risk to your portfolio or are new to investing, MoneyWeek asked the experts for funds and investment trusts you could consider in 2026
-
 The most popular fund sectors of 2025 as investor outflows continue
It was another difficult year for fund inflows but there are signs that investors are returning to the financial markets