Has the Dow hit the bottom for now?
The world's stock markets have fallen dramatically in the last few days. But for the Dow Jones, the scene is set for a very large counter-trend rally, says John C Burford. Here, he explains why.
Get the latest financial news, insights and expert analysis from our award-winning MoneyWeek team, to help you understand what really matters when it comes to your finances.
You are now subscribed
Your newsletter sign-up was successful
Want to add more newsletters?

Twice daily
MoneyWeek
Get the latest financial news, insights and expert analysis from our award-winning MoneyWeek team, to help you understand what really matters when it comes to your finances.

Four times a week
Look After My Bills
Sign up to our free money-saving newsletter, filled with the latest news and expert advice to help you find the best tips and deals for managing your bills. Start saving today!
As I write this special update early on Tuesday morning, the Dow is bouncing off important levels. Although by the time you read this, the market may well be somewhere else!
I thought I would alert you to a likely bottom in my Elliott wave 3, as I outlined on Monday.
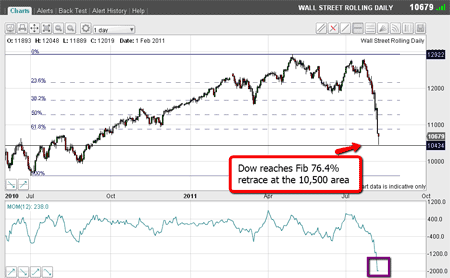
Here is the daily chart as of this morning:
MoneyWeek
Subscribe to MoneyWeek today and get your first six magazine issues absolutely FREE

Sign up to Money Morning
Don't miss the latest investment and personal finances news, market analysis, plus money-saving tips with our free twice-daily newsletter
Don't miss the latest investment and personal finances news, market analysis, plus money-saving tips with our free twice-daily newsletter

(Click on the chart for a larger version)
Just take a moment to admire the precipitous fall we have just witnessed in only a few days.
We are at one of the most historic periods in stock market history similar to that in 1929 (slightly before my time, I may add!).
The scene is set for a large rally
As of this morning, the market has fallen to the 10,450 level and is currently bouncing.
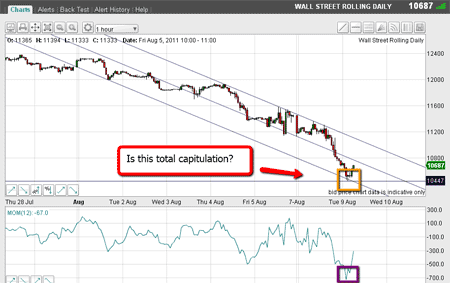
This level is very close to the Fibonacci 76.4% retrace of the entire wave up from the July 2010 low. Momentum is totally washed out (purple box) on this daily chart, as it is on the hourly chart:

(Click on the chart for a larger version)
Also, I have drawn a trio of tramlines which fit the highs and lows very well.
At the 10,450 level, the market has hit the lowest tramline and is heading for the central one.
Short-term traders will be taking profits on their short sales here.
With this technical picture of total capitulation by the bulls, saturation headline gloom and doom reports in the mainstream (and specialist) media, the scene is set for a very large counter-trend rally.
If I am right, we can call the 10,450 level as the end of wave 3, leading to a rally in wave 4 prior to a plunge to new lows in a final wave 5.
The market then would be ready to embark on a multi-month rally, so I will be looking to trade from the long side. Seems that I shall have to work on my long-trading skills!
But first, the market must squeeze the army of shorts who have become complacent making huge profits in a very short space of time.
Rallies will be very sharp from here, I believe.
Of course, I may be wrong and the market could make new lows from here. But as I see it, the odds favour my above scenario.
Don't miss my next trading insight. To receive all my spread betting blog posts by email, as soon as I've written them, just sign up here .
Get the latest financial news, insights and expert analysis from our award-winning MoneyWeek team, to help you understand what really matters when it comes to your finances.
John is is a British-born lapsed PhD physicist, who previously worked for Nasa on the Mars exploration team. He is a former commodity trading advisor with the US Commodities Futures Trading Commission, and worked in a boutique futures house in California in the 1980s.
He was a partner in one of the first futures newsletter advisory services, based in Washington DC, specialising in pork bellies and currencies. John is primarily a chart-reading trader, having cut his trading teeth in the days before PCs.
As well as his work in the financial world, he has launched, run and sold several 'real' businesses producing 'real' products.
-
 Average UK house price reaches £300,000 for first time, Halifax says
While the average house price has topped £300k, regional disparities still remain, Halifax finds.
-
 Barings Emerging Europe trust bounces back from Russia woes
Barings Emerging Europe trust has added the Middle East and Africa to its mandate, delivering a strong recovery, says Max King