Has the bell rung on the Dow Jones index?
The Dow has become polarised between traders who see an end to the bull run, and those that believe it will run on, says John C Burford.
Get the latest financial news, insights and expert analysis from our award-winning MoneyWeek team, to help you understand what really matters when it comes to your finances.
You are now subscribed
Your newsletter sign-up was successful
Want to add more newsletters?

Twice daily
MoneyWeek
Get the latest financial news, insights and expert analysis from our award-winning MoneyWeek team, to help you understand what really matters when it comes to your finances.

Four times a week
Look After My Bills
Sign up to our free money-saving newsletter, filled with the latest news and expert advice to help you find the best tips and deals for managing your bills. Start saving today!
It is said that nobody rings a bell at the stock exchange when the market has hit top tick. But recently it seems that many pundits must have at least heard a faint tinkling.
Everywhere you look, they have been falling over themselves forecasting an imminent dip in the stock market. Such widespread opinions are even featured in the pages of the media (and even made it to the radio, I note).
They reason that the bull market since March 2009 is getting very long in the tooth, volatility is on the floor, complacency is up in the ceiling, and valuations are getting stretched. The market has to fall, surely?
MoneyWeek
Subscribe to MoneyWeek today and get your first six magazine issues absolutely FREE

Sign up to Money Morning
Don't miss the latest investment and personal finances news, market analysis, plus money-saving tips with our free twice-daily newsletter
Don't miss the latest investment and personal finances news, market analysis, plus money-saving tips with our free twice-daily newsletter
And yesterday, problems at a Portuguese bank surfaced. This seemed to confirm the shaky nature of the banking sector, which lead the way down in stocks in the 20072009 crash. Nervous selling resulted.
So is this the end of the bull market? Today, I want to look at sentiment readings and the large wedge patterns I have been following for many weeks to see which way the markets are heading.
You can't always rely on your gut feeling'
Do you remember the chairman of the Fed, Alan Greenspan, warning of "irrational exuberance" in the stock markets back in December 1996? That phrase has entered market lore and even gave birth to the famous bumper sticker seen during the dotcom crash: "I want to be irrationally exuberant again!"
Well, that dampener wasn't nearly enough to break up the party the Nasdaq zoomed higher and only topped over three years later. That's a painfully long time to be holding a short trade if you merely traded on Greenspan's words!
Although the above conditions are indeed necessary for a major top, they are not sufficient.
It is one thing to have a gut feeling' that stocks are too high, but that is a poor basis on which to base your trading decisions.
Normally, I would take this display of pundit bearishness as a contrarian bullish sign, and indeed, many bulls are doing just that. But I believe this is the incorrect reading this time.
What the sentiment readings tell us
The market is too high' story has been building for many weeks as the market climbed and has now become mainstream.
But the current market is Janus-faced. While the pundits are expecting a decline, professional money managers are certainly not, judging by the various extreme sentiment readings I follow.
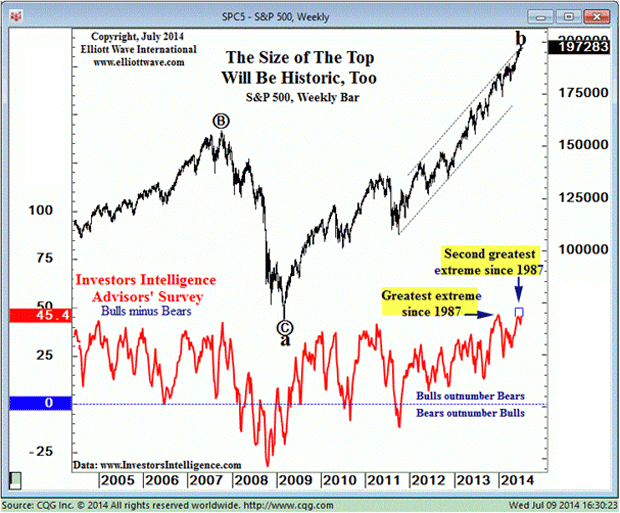
Here is just one amazing chart of the Investors Intelligence survey of US advisors:

(Chart courtesy of www.elliottwave.com)
As you can see, since at least 2005, every time the plurality of bulls over bears reaches the 44-45 level, stocks make a high. But this week, that plurality reached the second highest level since the 1987 top. The highest level was reached in early June.
So, what does this information tell us? Simply that professional advisors have created the biggest net bullish herd in 27 years surely a very noteworthy event. The vast majority of pros do not expect a bothersome dip a fact borne out by the very low Vix (fear index) readings.
Has the market top already been hit?
Sentiment-wise, the pundits are closer to the real economy, while the money managers are focused on their next bonus (and whether they can borrow even more to shove into shares).
There has been widespread publicity over the news that the world's central banks are herding together to buy shares. If so, this is bearish, because central banks are always behind the curve and, like governments, are always fighting the last war.
Wouldn't it be entirely in keeping with central banks' record if stocks started heading down now?
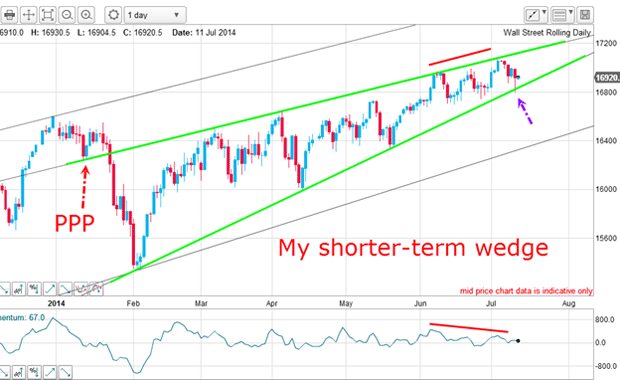
Over the past couple of days, the market has declined. So I want to look at where we are in relation to the large wedge patterns I have been following for many weeks. To me, that holds the key to any calls for a top.
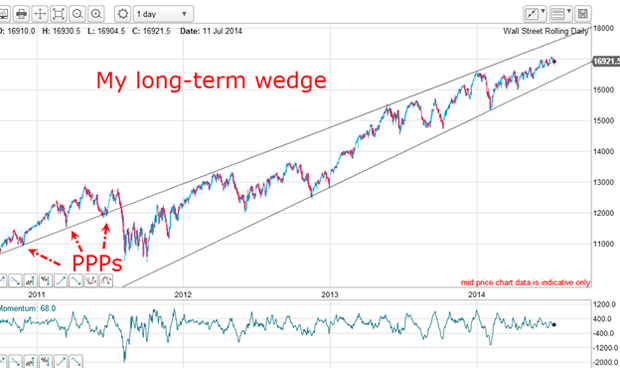
Here is my long-term wedge going back over three years:

My verdict? I can claim the trend has turned down when the lower line has been broken. But because the market is mid-way between the lines, the uptrend is intact.
The market's fear of heights

This wedge is very clean with accurate touch points on both lines including yesterday's sell-off low (which confirmed the lower line as solid support, so far).
My verdict? With no break of the wedge, the uptrend is intact. It would take a break of yesterday's low to turn the short-term trend down.
But momentum has been weakening since the March high with a series of lower highs, so buying is drying up.
But with the market sentiment swinging between bullish (the pros) and bearish (the rest of us), I believe volatility will start to increase with wider and wider swings.
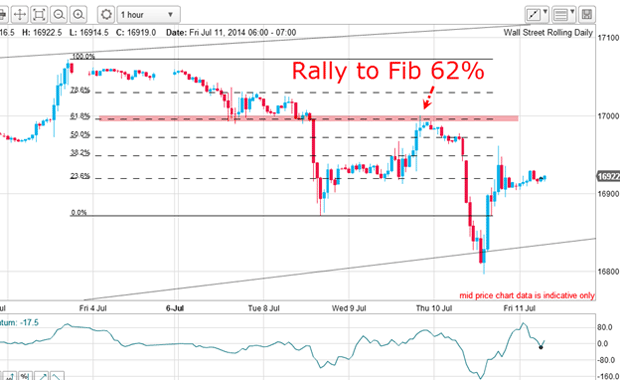
Actually, there was a trade on yesterday:

The decline off the 3 July high was reversed at the Tuesday low and the relief rally carried to a precise hit on the Fibonacci 62% level where a low-risk short trade was indicated.
The subsequent plunge of about 200 points was an opportunity for a short-term profit. But the volatile rally off yesterday's low was a measure of how nervous the market is at these heights.
Get the latest financial news, insights and expert analysis from our award-winning MoneyWeek team, to help you understand what really matters when it comes to your finances.
John is is a British-born lapsed PhD physicist, who previously worked for Nasa on the Mars exploration team. He is a former commodity trading advisor with the US Commodities Futures Trading Commission, and worked in a boutique futures house in California in the 1980s.
He was a partner in one of the first futures newsletter advisory services, based in Washington DC, specialising in pork bellies and currencies. John is primarily a chart-reading trader, having cut his trading teeth in the days before PCs.
As well as his work in the financial world, he has launched, run and sold several 'real' businesses producing 'real' products.
-
 Average UK house price reaches £300,000 for first time, Halifax says
While the average house price has topped £300k, regional disparities still remain, Halifax finds.
-
 Barings Emerging Europe trust bounces back from Russia woes
Barings Emerging Europe trust has added the Middle East and Africa to its mandate, delivering a strong recovery, says Max King