Great trades in the Dow Jones index
Volatility in the Dow has presented us with a series of short-term trades, says John C Burford. But how is the index shaping up in the longer run?
Get the latest financial news, insights and expert analysis from our award-winning MoneyWeek team, to help you understand what really matters when it comes to your finances.
You are now subscribed
Your newsletter sign-up was successful
Want to add more newsletters?

Twice daily
MoneyWeek
Get the latest financial news, insights and expert analysis from our award-winning MoneyWeek team, to help you understand what really matters when it comes to your finances.

Four times a week
Look After My Bills
Sign up to our free money-saving newsletter, filled with the latest news and expert advice to help you find the best tips and deals for managing your bills. Start saving today!
I have been looking for a significant decline in US stocks for some time, even as the indexes have been powering into new high ground for many months. And in my post of 4 December, I asked the question: are stocks in a decline?
I laid out my case that the top was near based upon extreme sentiment readings. These readings were also a critical piece of evidence in the S&P, which had hit an important Fibonacci target at 1,815.
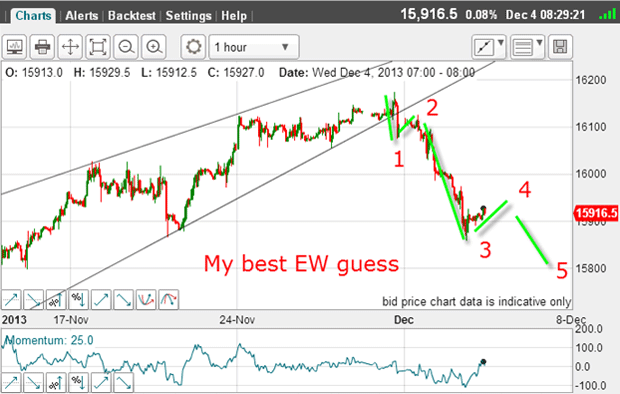
I also pointed out that the Dow was making a wedge (or ascending triangle). That is normally a terminating pattern prior to a sharp reversal, especially if it lies in the fifth wave position of a larger Elliot-wave pattern.
MoneyWeek
Subscribe to MoneyWeek today and get your first six magazine issues absolutely FREE

Sign up to Money Morning
Don't miss the latest investment and personal finances news, market analysis, plus money-saving tips with our free twice-daily newsletter
Don't miss the latest investment and personal finances news, market analysis, plus money-saving tips with our free twice-daily newsletter
This was the wedge and the break of the lower wedge line that I showed then:

The break of the line was an excellent place to enter a short trade at low risk (the stop could have been placed just above the high).
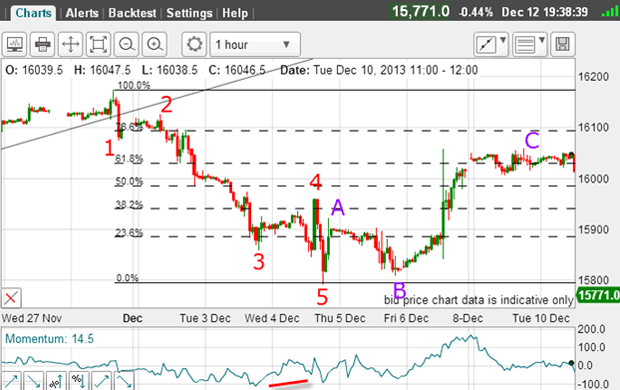
The long and strong nature of the decline off the 16,100 high is totally characteristic of third waves, and the marked labels were my best guess at the time. To complete the pattern, I needed to see a rally in wave 4, then a new low in wave 5. When wave 5 was finished, a decent rally would ensue.
This rally would hopefully be in an A-B-C three-wave pattern to either a Fibonacci 50% or 62% retrace, which are the most common places for turns.
And this is how that played out:

A very pretty confirmation of my forecast
And right on cue, the market started a rally for my A wave. It then declined again following release of the US jobs data last Friday, which would normally have been viewed as bearish, since it suggested that the Fed would almost certainly start tapering operations soon.
But this conventional explanation was wrong. It was wrong, because the market had not yet put in the C wave, which is what Elliot wave theory (EWT) calls for after a five-wave down move.
This was yet another perverse' market reaction to the news an event which has become very common in recent years as we live through QE (quantitative easing) times.
In fact, for months now, many observers have been pointing out that bad news was good for stocks. How perverse is that?
Why you need to understand Elliot wave theory
In any case, the market staged the C wave rally (which itself has five sub-waves) to the Fibonacci 62% area. That is a common turning point for C wave corrections.
The important point here is that by using basic EWT, as I have done, all of the market moves were flagged well in advance and the roadmap was laid out for you. I can think of no other method that can do that with almost pinpoint accuracy. This was a textbook example.
So how has the Dow behaved since then?

The equality rule
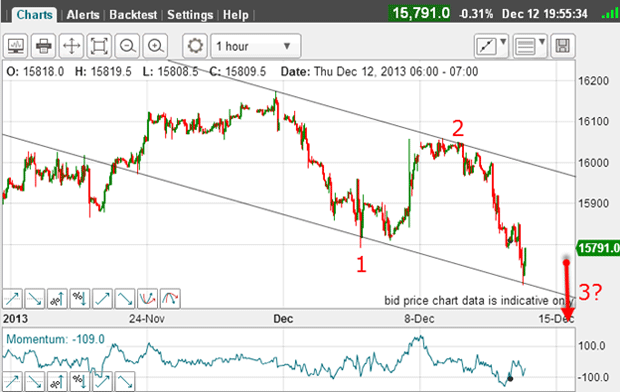
I can do this because markets are fractals. It helps to sometimes look into your third waves and zoom in ever closer and see how many five-wave patterns are contained within each larger five-wave pattern. Markets are like Russian dolls smaller ones fitting neatly inside larger ones.
I have also drawn my tentative tramlines. The upper one has only two touch points and the lower one has at least three. The market last night bounced sharply off it. This means that the option is still there to label the move off the 29 November high as a possible A-B-C, which is corrective.
In fact, if this an A-B-C, then waves A and C are about equal. The equality rule is quite common in A-B-C patterns.
The key test will be a break of the lower tramline. That will be a signal that the large third wave is in full swing.
The bumpy road ahead

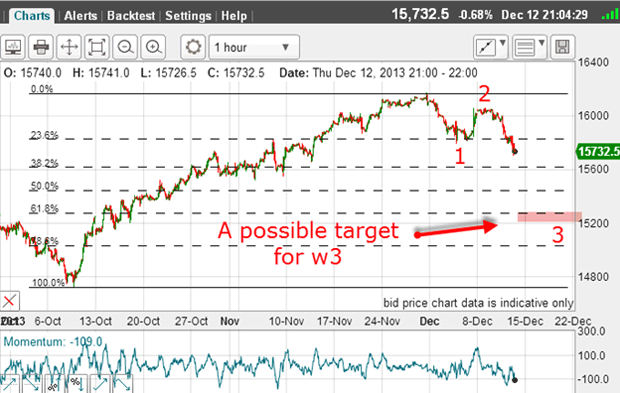
This shows the huge final leg up from the early October low and the decline off the 29 November high. I have my wave 1 and wave 2 in place and we are currently working with wave 3.
We know that third waves are usually long and strong. And normally, I would expect it to be much larger than wave 1. If we assume it will be about twice as large as wave 1 (which is about 400 pips long), then a move of 800 pips or more would not be unusual.
That would set a possible target for wave 3 in the 15,300 area, which is exactly where the Fibonacci 62% retrace lies. And the 62% level is a very common turning point.
But I cannot rule out the A-B-C interpretation just yet. There will be volatility in the markets as the date-certain event (the Fed minutes) next week approaches.
But we have already benefited from the recently increased volatility, because it has presented us with a series of possible excellent short-term trades using my very simple trading methods.
Get the latest financial news, insights and expert analysis from our award-winning MoneyWeek team, to help you understand what really matters when it comes to your finances.
John is is a British-born lapsed PhD physicist, who previously worked for Nasa on the Mars exploration team. He is a former commodity trading advisor with the US Commodities Futures Trading Commission, and worked in a boutique futures house in California in the 1980s.
He was a partner in one of the first futures newsletter advisory services, based in Washington DC, specialising in pork bellies and currencies. John is primarily a chart-reading trader, having cut his trading teeth in the days before PCs.
As well as his work in the financial world, he has launched, run and sold several 'real' businesses producing 'real' products.
-
 ISA fund and trust picks for every type of investor – which could work for you?
Whether you’re an ISA investor seeking reliable returns, looking to add a bit more risk to your portfolio or are new to investing, MoneyWeek asked the experts for funds and investment trusts you could consider in 2026
-
 The most popular fund sectors of 2025 as investor outflows continue
It was another difficult year for fund inflows but there are signs that investors are returning to the financial markets