Gold retreats – but is finding support
After following the tramlines lower, gold is attempting to stage a rally. But the charts are showing tough resistance ahead, says John C Burford - can gold power through?
Get the latest financial news, insights and expert analysis from our award-winning MoneyWeek team, to help you understand what really matters when it comes to your finances.
You are now subscribed
Your newsletter sign-up was successful
Want to add more newsletters?

Twice daily
MoneyWeek
Get the latest financial news, insights and expert analysis from our award-winning MoneyWeek team, to help you understand what really matters when it comes to your finances.

Four times a week
Look After My Bills
Sign up to our free money-saving newsletter, filled with the latest news and expert advice to help you find the best tips and deals for managing your bills. Start saving today!
Once again this morning, I am faced with several alternative markets to cover the euro, the Dow and gold are all shaping up nicely along their tramlines, Fibonacci levels and Elliott waves.And our occasional friend the Aussie dollar is doing likewise.
But gold looks particularly interesting to me this morning so gold it is.
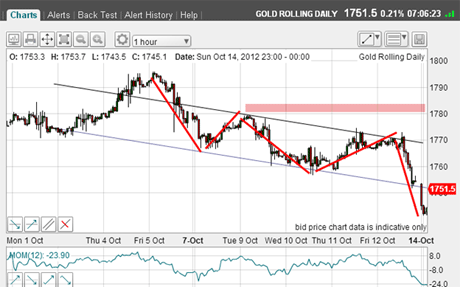
In last Friday'spost, I pointed out that on Friday morning gold was truly at a moment of decision.It had two clear options: either the three-wave pattern off the $1,796 high was the extent of the dip, and we could expect a resumption of the bull market; or the pattern was a continuation' pattern down and new lows would beckon.
MoneyWeek
Subscribe to MoneyWeek today and get your first six magazine issues absolutely FREE

Sign up to Money Morning
Don't miss the latest investment and personal finances news, market analysis, plus money-saving tips with our free twice-daily newsletter
Don't miss the latest investment and personal finances news, market analysis, plus money-saving tips with our free twice-daily newsletter
It was truly at a moment of truth, heightened by the extreme bullishness of speculators (as revealed by the COT data more later).
Well, later on Friday I got my answer:

(Click on the chart for a larger version)
The market attempted to rally above my tramline in the $1,770 area later on Friday, but failed and by Friday's close, it had retreated down to my lower tramline at $1,750.
That was a clear indication that we had a continuation pattern on our hands and new lows lay ahead.
With the weekend upon the markets, that gives us all the space to examine our trading plans in detail without market noise distracting us.I recommend taking some time then to gather your thoughts.
"But isn't that a powerful example of how tramlines represent areas of resistance for rallies and support for dips? I thought you would like that one!"
My line in the sand was the area in the pink bar, as a rally to this area wouldprobably indicate new highs ahead.
So there we had a clear plan:short near the upper tramline with a protective stop (to reverse to long?) in the pink zone.That was a relatively low-risk trade.
Let's see how things developed:

(Click on the chart for a larger version)
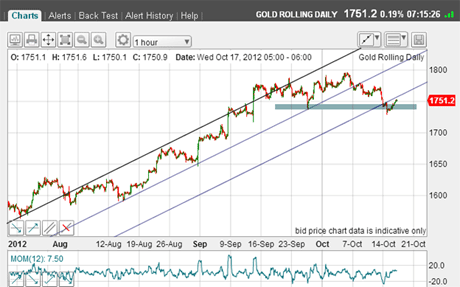
Here is the tramline trip I have been working with on the rally segment. Yesterday, heavy selling brought about a plunge below my lowest tramline and crucially, a move below the major chart support low at the $1,740 level (blue-grey bar).
It was beginning to look as if we have seen the highs for this year at least and we had started a bear market.
But hold your horses!Before we go galloping along the bear's trail, I have a few thoughts that put the bearish case into question at least for now.
Let's see what they are.
Is this an ABC rally extension?

(Click on the chart for a larger version)
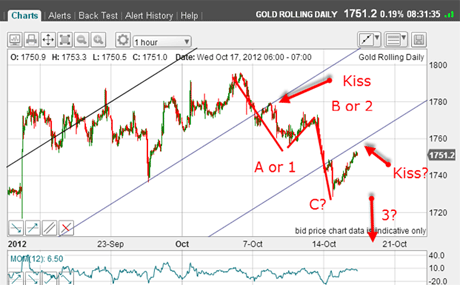
The move down off the $1,796 high can be counted so far as an A-B-C or as a 1-2-3 in progress.
If an A-B-C, it would imply a rally extension bullish.
If a 1-2-3, then wave 3 should extend down bearish.
This morning, we had a move up off yesterday's $1,730 low as it attempted a tramline kiss.And note the previous kiss on the centre tramline.This indicates my tramlines are still valid.
This rally could mean yesterday's low is actually wave C.
Here is a closer look:

(Click on the chart for a larger version)
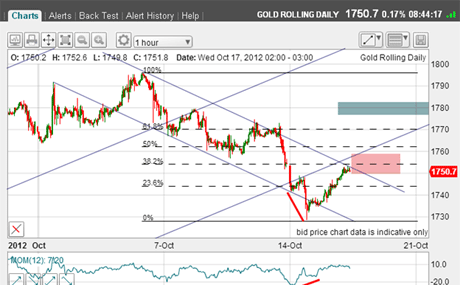
I have a superb lower down-sloping tramline with a prior pivot point(PPP) and several touch-points. And note the large positive momentum divergence at the $1,730 low that is short-term bullish action, so the present rally is not unexpected.
And as I write, the market is challenging my upper line just as it did last Friday!
So, will history repeat?
Note that we are at the crossing of two important tramlines and the Fibonacci 38% retrace a triple threat to the rally.
This means that there is heavy resistance in the pink zone.Bulls watch out!
But if the market can overcome this resistance, my line in the sand is in the blue bar above the previous minor high at $1,770. That would swing the odds in favour of new highs soon.
Commitments of Traders data hint at longs
If we are in a new downtrend, confirmation would come if the market can break below the $1,730 level. That would indicate we are in a long and strong third wave down the textbook case.
So these are the two critical levels I shall be watching $1,730 and $1,780.
But already, the bulls must be getting increasingly nervous as yesterday, the market had taken back over $60 off the top.
Now, long-term investors would probably not be shaken out of the tree by this dip.I write about swing trades, and a $60 move equates to a £6,000 credit or debit on a £10 spread bet. I can be confident that this would grab the attention of most swing traders, especially if in debit!
And finally, does the latest COT data reveal anything significant?
| Contracts of 100 Troy ounces | Row 0 - Cell 1 | Row 0 - Cell 2 | Row 0 - Cell 3 | Open interest: 484,359 | ||||
| Commitments | ||||||||
| 247,401 | 35,452 | 32,187 | 131,714 | 398,702 | 411,302 | 466,341 | 73,057 | 18,018 |
| Changes from 10/02/12 (Change in open interest: 3,451) | ||||||||
| 7,967 | 4,344 | 5,460 | -4,536 | -6,818 | 8,891 | 2,986 | -5,440 | 465 |
| Percent of open in terest for each category of traders | ||||||||
| 51.1 | 7.3 | 6.6 | 27.2 | 82.3 | 84.9 | 96.3 | 15.1 | 3.7 |
| Number of traders in each category (Total traders: 354) | ||||||||
| 223 | 59 | 68 | 47 | 44 | 295 | 155 | Row 8 - Cell 7 | Row 8 - Cell 8 |
If you're a new reader, or need a reminder about some of the methods I refer to in my trades, then do have a look at my introductory videos:
The essentials of tramline trading
An introduction to Elliott wave theory
Advanced trading with Elliott waves
Don't miss my next trading insight. To receive all my spread betting blog posts by email, as soon as I've written them, just sign up here . If you have any queries regarding MoneyWeek Trader, please contact us here.
Get the latest financial news, insights and expert analysis from our award-winning MoneyWeek team, to help you understand what really matters when it comes to your finances.
John is is a British-born lapsed PhD physicist, who previously worked for Nasa on the Mars exploration team. He is a former commodity trading advisor with the US Commodities Futures Trading Commission, and worked in a boutique futures house in California in the 1980s.
He was a partner in one of the first futures newsletter advisory services, based in Washington DC, specialising in pork bellies and currencies. John is primarily a chart-reading trader, having cut his trading teeth in the days before PCs.
As well as his work in the financial world, he has launched, run and sold several 'real' businesses producing 'real' products.
-
 UK interest rates live: rates held at 3.75%
The Bank of England’s Monetary Policy Committee (MPC) met today to decide UK interest rates, and voted to hold rates at their current level
-
 MoneyWeek Talks: The funds to choose in 2026
Podcast Fidelity's Tom Stevenson reveals his top three funds for 2026 for your ISA or self-invested personal pension