The gold price is getting closer to my target
With the gold price approaching his target in the charts, John C Burford analyses where the market may be heading to next.
Get the latest financial news, insights and expert analysis from our award-winning MoneyWeek team, to help you understand what really matters when it comes to your finances.
You are now subscribed
Your newsletter sign-up was successful
Want to add more newsletters?

Twice daily
MoneyWeek
Get the latest financial news, insights and expert analysis from our award-winning MoneyWeek team, to help you understand what really matters when it comes to your finances.

Four times a week
Look After My Bills
Sign up to our free money-saving newsletter, filled with the latest news and expert advice to help you find the best tips and deals for managing your bills. Start saving today!
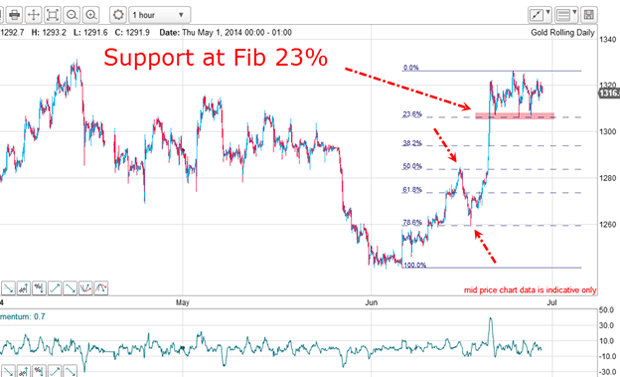
Gold is at a crossroads. In my post of 20 June, I showed that the previous week's big rally was a short squeeze and moved the market up to the $1,320 area, which is at a major tramline target:

I forecast back then that I expected stiff resistance here and the market has duly obliged by barely budging for the past six trading days.
So today, I thought I would discuss where I think gold is heading next.
MoneyWeek
Subscribe to MoneyWeek today and get your first six magazine issues absolutely FREE

Sign up to Money Morning
Don't miss the latest investment and personal finances news, market analysis, plus money-saving tips with our free twice-daily newsletter
Don't miss the latest investment and personal finances news, market analysis, plus money-saving tips with our free twice-daily newsletter
The market recognises Fibonacci levels

I have drawn the Fibonacci levels using the most recent low and high as pivot points. I chose the bottom low of 5 June instead of the second low of 6 June (which is a possibility), because the intervening highs and lows make very accurate hits on the various Fibonacci levels.
For instance, the first rally reversed right at the 50% level and then the subsequent dip was held at precisely the 23% level (the arrows). At these points, the market had not made its final high, so how did the market know' to reverse at these Fibonacci levels?
What I think will happen next
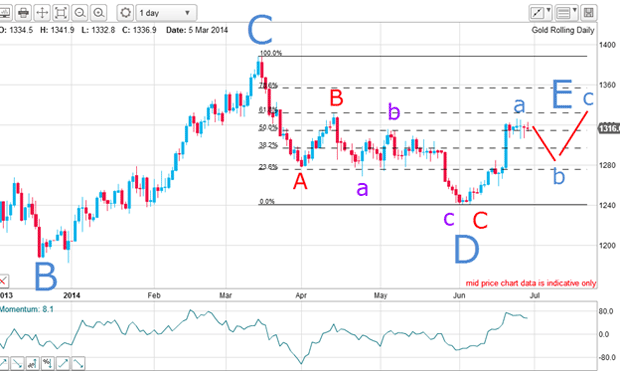
If the market cannot punch up through this tramline very soon, it may well reverse course and move down through this Fibonacci support. If it did that, then that would set up a very interesting Elliott wave (EW) possibility:

Here are my established EW labels. Now if the market retreats from here, I can call that wave a up. A decline here would be a new wave b, which would lead to a new rally to make a high above wave a in wave c, which would correspond to my E wave.
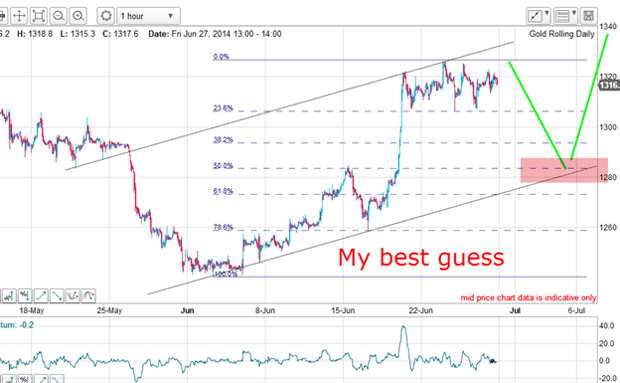
So that is my best guess at present. If this pans out, where should the b wave turn?

Here is my best guess on the hourly chart. I have a suggested tramline pair. The upper tramline already has two excellent PPPs (prior pivot points) and two accurate touch points, making it a very reliable line of resistance.
The lower line is the tentative one, but if the market can dip to the Fibonacci 50% level a common retracement then it would meet the lower tramline support this coming week.
That should be the b wave, leading to a new high in wave c. A long trade at the b wave low would make sense.
But is there any evidence that this is a realistic scenario?
Why gold is the most emotional market
| (Contracts of 100 troy ounces) | Row 0 - Cell 1 | Row 0 - Cell 2 | Row 0 - Cell 3 | Open interest: 392,388 | ||||
| Commitments | ||||||||
| 183,433 | 62,574 | 24,959 | 142,864 | 274,471 | 351,256 | 362,004 | 41,132 | 30,384 |
| Changes from 06/17/14 (Change in open interest: 12,545) | ||||||||
| 21,381 | -21,183 | -1,172 | -14,159 | 39,123 | 6,050 | 16,768 | 6,495 | -4,223 |
| Percent of open in terest for each category of traders | ||||||||
| 46.7 | 15.9 | 6.4 | 36.4 | 69.9 | 89.5 | 92.3 | 10.5 | 7.7 |
| Number of traders in each category (Total traders: 276) | ||||||||
| 128 | 72 | 66 | 52 | 55 | 208 | 167 | Row 8 - Cell 7 | Row 8 - Cell 8 |
Starting at the week's changes Tuesday to Tuesday, the hedgies (non-commercials) have swung massively behind the rally. In the previous week, they were roughly two-to-one bullish and in one week, they have reduced their shorts and increased their longs to where they are now three-to-one bullish a massive 50% increase in bullish commitment.
In a similar vein, the small traders have also jumped on the bull's bandwagon.
But note how the commercials (the smart money) have taken the other side and are now two-to-one bearish.
These swings are huge and have forced the $60 rally in that period. Do you remember back in December, when the Daily Sentiment Index (DSI) was plumbing new depths of bullish sentiment of 4%?
Now you can see why these immense swings in sentiment are the reason I call the gold market the most emotional on the board.
Incidentally, it is a similar picture in silver, which I mentioned last time.
How long will the party last?
Of course, the alternative scenario is for the market to continue its rally and to head up towards the old high at the $1,400 level. But I consider that less likely, because of what the COT data is telling me.
However, there is a recent precedent for this. In my third chart above, the big C wave rally made a very overbought momentum reading in mid-February, but the market still climbed higher into March. Just because momentum is high does not always mean the move is very close to exhaustion.
Another factor is the Damascene conversion of many bearish pundits in recent days just read the many wildly bullish forecasts coming out of the woodwork.
In the highly emotional gold market, often all it takes is a small rally to get the bulls excited!
performance is not a reliable indicator of future results. Please seek independent financial advice if necessary. Customer Services: 020 7633 3600.
Get the latest financial news, insights and expert analysis from our award-winning MoneyWeek team, to help you understand what really matters when it comes to your finances.
John is is a British-born lapsed PhD physicist, who previously worked for Nasa on the Mars exploration team. He is a former commodity trading advisor with the US Commodities Futures Trading Commission, and worked in a boutique futures house in California in the 1980s.
He was a partner in one of the first futures newsletter advisory services, based in Washington DC, specialising in pork bellies and currencies. John is primarily a chart-reading trader, having cut his trading teeth in the days before PCs.
As well as his work in the financial world, he has launched, run and sold several 'real' businesses producing 'real' products.
-
 Average UK house price reaches £300,000 for first time, Halifax says
While the average house price has topped £300k, regional disparities still remain, Halifax finds.
-
 Barings Emerging Europe trust bounces back from Russia woes
Barings Emerging Europe trust has added the Middle East and Africa to its mandate, delivering a strong recovery, says Max King