Gold has hit an important Fibonacci level
Gold's dramatic rally will have surprised many traders who were still short. John C Burford looks at why it's vital to catch a trend early, and examines the charts to see where gold might go next.
Get the latest financial news, insights and expert analysis from our award-winning MoneyWeek team, to help you understand what really matters when it comes to your finances.
You are now subscribed
Your newsletter sign-up was successful
Want to add more newsletters?

Twice daily
MoneyWeek
Get the latest financial news, insights and expert analysis from our award-winning MoneyWeek team, to help you understand what really matters when it comes to your finances.

Four times a week
Look After My Bills
Sign up to our free money-saving newsletter, filled with the latest news and expert advice to help you find the best tips and deals for managing your bills. Start saving today!
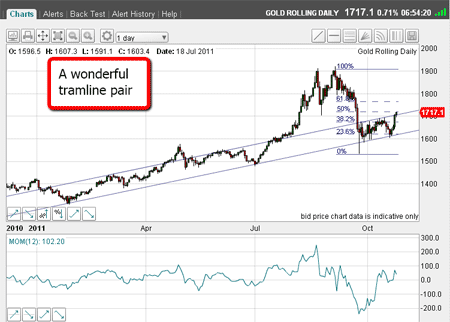
In my previouspost on gold on 14 October, I noted how the market was picking itself up off the floor from the sharp decline to the $1,530 area on 26 September and all rallies to the Fibonacci 38% retrace were being turned back.
In mypost I wrote: "Note that all rallies have been stopped by the huge resistance put up by the 38% level. Now, if the market can push above this resistance, the move will very likely be sharp, as there will be masses of buy-stops in this region".
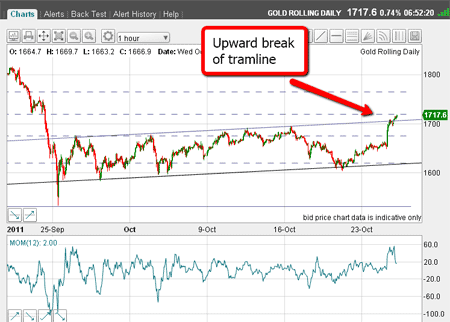
Well, we certainly got that push above the 38% level yesterday! In fact, as of this morning, the market has carried to the $1,720 area a rally of $120 off yesterday's low.
MoneyWeek
Subscribe to MoneyWeek today and get your first six magazine issues absolutely FREE

Sign up to Money Morning
Don't miss the latest investment and personal finances news, market analysis, plus money-saving tips with our free twice-daily newsletter
Don't miss the latest investment and personal finances news, market analysis, plus money-saving tips with our free twice-daily newsletter
That is a serious rally.
The speed of this push was astonishing, and confirmed my view that there were masses of buy-stops placed just above the 38% level put there by the growing army of gold bears that have noted the double top at the $1,920 area.
This illustrates why it is essential to have a sound money-management strategy in place, such as my 3% rule. (I am preparing a new video tutorial on my 3% rule which should be available very soon.)
As so often happens, late-comers to a new bear trend, who are often shorting near to near-term lows, are punished.
Trader Tip: Try to be early in a new trend. Most traders wait for confirmation' that a new trend is underway; such confirmation coming from the technical picture, or fundamentals.
For instance, they see that in recent days, the market has moved by large amounts and then consider it safe to enter as the new trend is confirmed. This often proves to be the very worst time to trade! He who hesitates loses big.
Here is the daily chart showing my lovely tramline pair:

I really like these lines there are many superb touch-points going back almost a year.
But with yesterday's push, the market has now moved above the upper tramline:

(Click on the chart for a larger version)
The 50% Fibonacci level looms
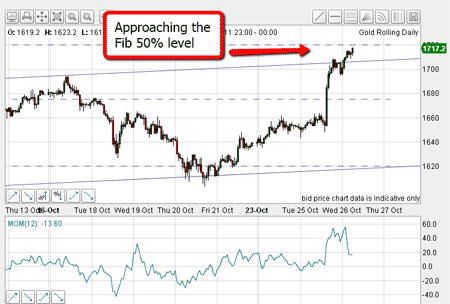
However, we are getting very close to the Fibonacci 50% retrace level at $1,720. The 50% retrace level is a common area where markets turn around.
Here is a close-up of the current chart:

Because I believe we are in a bear market (for many reasons), I expect this 50% retrace level will turn out to be a formidable barrier for further gains.
That is why I shall be looking to enter short trades at or above current levels.
It's time to trade carefully
Short-term momentum is overbought, and if we see a move down in the Dow, then gold should follow.
More likely, my trade will be short-term, as I expect the market to consolidate its gains for now.
Many of the "weak" shorts have been shaken out of the tree by yesterday's move, which removes that potential buying support.
Weak hands usually trade nervously and even a small adverse move will force them to exit (not that yesterday's rally was a small move!).
Strong hands, on the other hand, remain with their positions through thick and thin.
But with the developments of the on-going eurozone crisis meetings, markets will remain volatile. I expect to trade very lightly for now.
If you're a new reader, or need a reminder about some of the methods I refer to in my trades, then do have a look at my introductory videos:
The essentials of tramline trading
An introduction to Elliott wave theory
Don't miss my next trading insight. To receive all my spread betting blog posts by email, as soon as I've written them, just sign up here .
Get the latest financial news, insights and expert analysis from our award-winning MoneyWeek team, to help you understand what really matters when it comes to your finances.
John is is a British-born lapsed PhD physicist, who previously worked for Nasa on the Mars exploration team. He is a former commodity trading advisor with the US Commodities Futures Trading Commission, and worked in a boutique futures house in California in the 1980s.
He was a partner in one of the first futures newsletter advisory services, based in Washington DC, specialising in pork bellies and currencies. John is primarily a chart-reading trader, having cut his trading teeth in the days before PCs.
As well as his work in the financial world, he has launched, run and sold several 'real' businesses producing 'real' products.
-
 Can mining stocks deliver golden gains?
With gold and silver prices having outperformed the stock markets last year, mining stocks can be an effective, if volatile, means of gaining exposure
-
 8 ways the ‘sandwich generation’ can protect wealth
People squeezed between caring for ageing parents and adult children or younger grandchildren – known as the ‘sandwich generation’ – are at risk of neglecting their own financial planning. Here’s how to protect yourself and your loved ones’ wealth.