Why is GBP/USD not moving higher with the UK economy?
Everything points to a stronger pound - in the news at least. But here, John C Burford explains why the charts paint a very different picture.
Get the latest financial news, insights and expert analysis from our award-winning MoneyWeek team, to help you understand what really matters when it comes to your finances.
You are now subscribed
Your newsletter sign-up was successful
Want to add more newsletters?

Twice daily
MoneyWeek
Get the latest financial news, insights and expert analysis from our award-winning MoneyWeek team, to help you understand what really matters when it comes to your finances.

Four times a week
Look After My Bills
Sign up to our free money-saving newsletter, filled with the latest news and expert advice to help you find the best tips and deals for managing your bills. Start saving today!
I thought I would cover this market today, because its recent action starkly illustrates an important principle: contrary to popular opinion, the news does not drive the markets. Yet to some people, this notion is preposterous.
If you follow financial reports in the mainstream media and on many blogs, you will be forgiven for believing that the news dominates. There is no shortage of verbiage all kinds of topics. In fact, you could spend your whole life reading financial material, and still not cover it all.
And when a market makes a surprise' move, most commentators are left floundering trying to explain why.
MoneyWeek
Subscribe to MoneyWeek today and get your first six magazine issues absolutely FREE

Sign up to Money Morning
Don't miss the latest investment and personal finances news, market analysis, plus money-saving tips with our free twice-daily newsletter
Don't miss the latest investment and personal finances news, market analysis, plus money-saving tips with our free twice-daily newsletter
I do enjoy that.
Why sterling has stalled
In fact, I had a post on Monday on this subject.
But with mood music for the UK economy getting much more bullish - in contrast to the eurozone we should expect the GBP/USD to be getting stronger, surely?
Even the Chancellor is saying Britain is on the road to prosperity.
According to conventional analysis, with an expanding economy trade demand for sterling around the world should improve, as should the value of sterling. This seems quite logical.
But that is not what is occurring, at least not compared with the dollar.
With GBP/USD down almost four cents from last week's high, what is a conventional trader to think?
But there is an explanation! And it involves trader sentiment and the charts.
Here is the very long-term weekly chart:
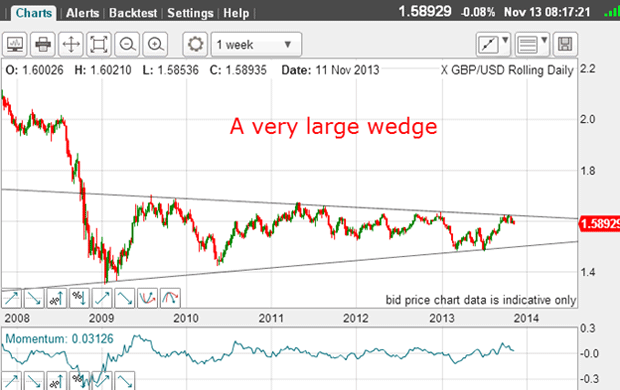
Since 2008, the market has been making a series of ever-narrowing swings with well-defined boundaries, especially the upper line.
This line is a line of resistance. Every time the market has risen to it, the strong resistance has capped the rallies.
That is a great place to consider a short trade, expecting the resistance to hold.
And last week, the market did rally to the line.
Let's now zoom in for a closer look:
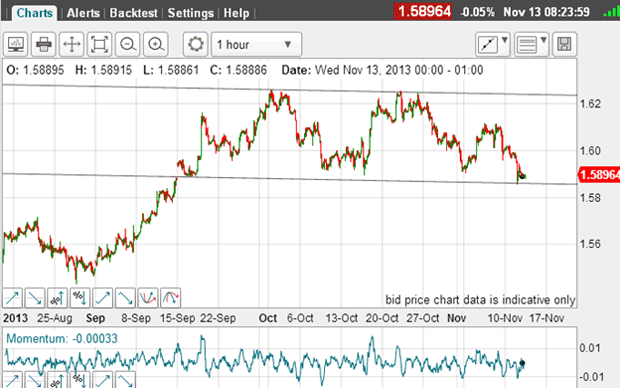
The upper line on the hourly chart is my wedge line and I have drawn a lower parallel line, which is my lower tramline.
Currently, the market is testing the lower tramline, having briefly touched it yesterday.
Note that the market made several attempts at punching through the 1.62 level.
Time to bring out the big guns
So that is why I was on the lookout for a possible short trade.
And that is why I brought out the heavy guns my tramline method on the hourly chart to pinpoint a good low-risk entry.
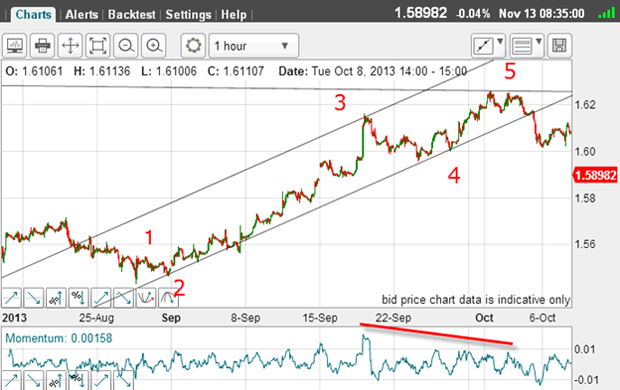
The rally from the August low has a clear five waves, with wave 3 being long and strong.
We also have a huge negative-momentum divergence at wave 5, which topped right on the long-term wedge resistance line.
Isn't that pretty?
To confirm the five-wave move was really over, the market broke below the lower tramline.
Remember the Elliott wave rule five waves complete leads to a reversal.
Also note that this occurred in the face of very bullish news and comments on the UK economy. If it is the news that drives the markets, would this not have occurred?
Navigating the market
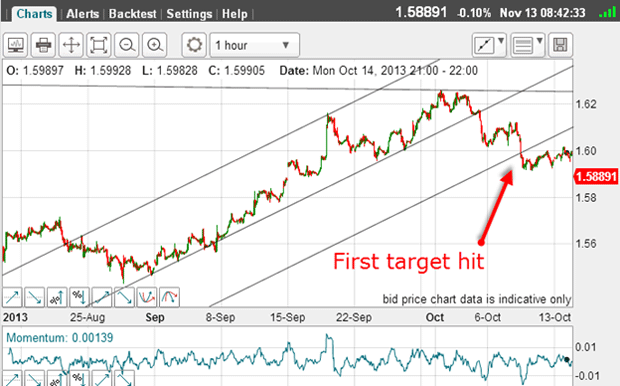
And here it is the market not only hit the target, but moved beyond it.
So what is next? Either the market will continue lower right away or try another rally attempt towards the 1.62 level.
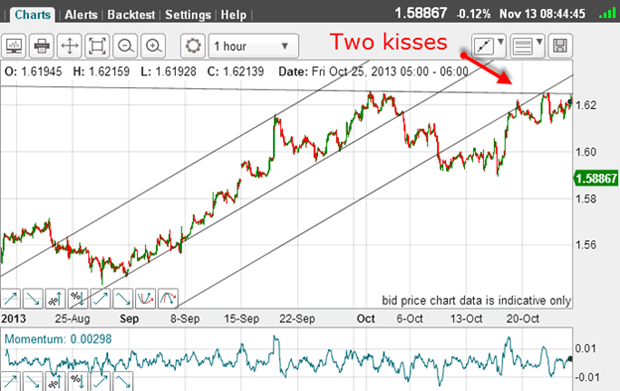
In fact, the market did rally and made two kisses on my third tramline the last one hitting the cross-over of the wedge line and the tramline. This is an area of extra-strong resistance. The odds definitely favoured a high here.
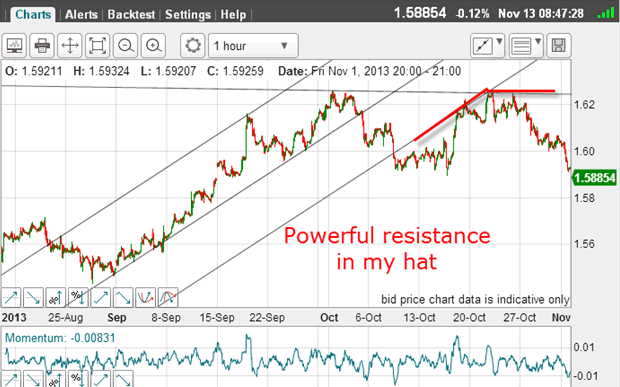
I have drawn in a hat' where the two resistance lines cross but the market was not powerful enough to punch through and therefore declined.
That was another excellent place to enter a short trade.
But rallies do not usually give up the ghost easily! There are many 'buy the dippers', who come in on declines, and this proved to be true:
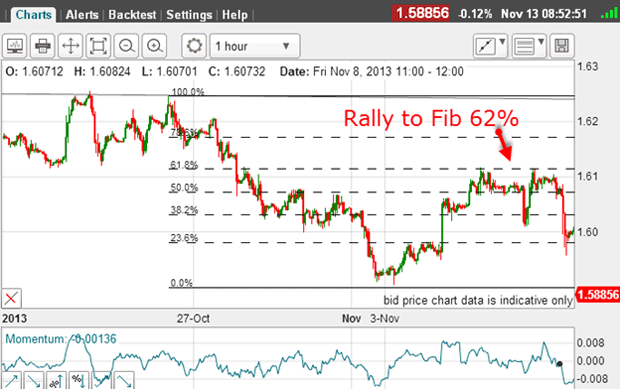
But the rally only carried to the Fibonacci 62% retrace of the most recent wave down a typical stopping point for a relief rally.
That was another excellent trade entry opportunity.
This morning, the market is edging lower:
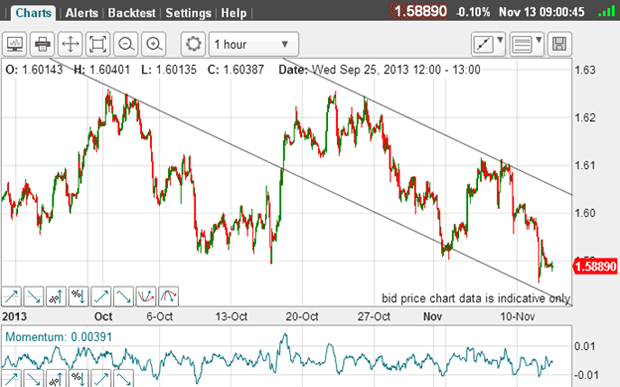
With a few highs and lows now in since the top, I can be quick on the trigger and draw in my first tentative tramlines for the decline.
I have used the major highs in early October as my PPP (prior pivot point) for the lower line. I feel that is important, as a stand-out PPP adds a lot of credibility to any line.
And gratifyingly, my upper parallel tramline lies across the two major highs.
These will be my guide for now.
The economy is not the market
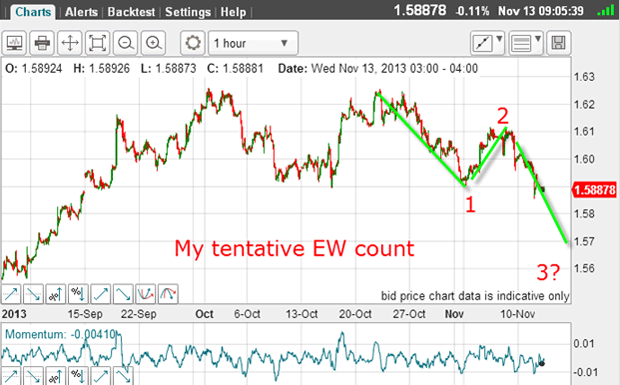
If we are in a wave 3 down, the move should be fast and furious. If it isn't, we may not be in a wave 3. So I will let the market speak before making final judgment.
Remember, I have a complete five-wave up count to the 1.62 tops, and so the next move will be down in one way or another.
And with my short trades above the market, I have the luxury of being able to move my stops to break-even, following my break-even rule.
So now I have a successful trade working and it was derived entirely from the chart price action.
The only thing I did with the news was to note the bullish sentiment extreme at the 1.62 topping area, where I knew a top was likely to be made.
Remember, the economy is not the same thing as the market. The market is driven by unseen mood swings and turns are made when sentiment becomes extreme.
What is the lesson learned here? Let the markets speak and direct your trading. Avoid the financial press unless you are detecting a sentiment extreme to trade against.
Get the latest financial news, insights and expert analysis from our award-winning MoneyWeek team, to help you understand what really matters when it comes to your finances.
John is is a British-born lapsed PhD physicist, who previously worked for Nasa on the Mars exploration team. He is a former commodity trading advisor with the US Commodities Futures Trading Commission, and worked in a boutique futures house in California in the 1980s.
He was a partner in one of the first futures newsletter advisory services, based in Washington DC, specialising in pork bellies and currencies. John is primarily a chart-reading trader, having cut his trading teeth in the days before PCs.
As well as his work in the financial world, he has launched, run and sold several 'real' businesses producing 'real' products.
-
 ISA fund and trust picks for every type of investor – which could work for you?
Whether you’re an ISA investor seeking reliable returns, looking to add a bit more risk to your portfolio or are new to investing, MoneyWeek asked the experts for funds and investment trusts you could consider in 2026
-
 The most popular fund sectors of 2025 as investor outflows continue
It was another difficult year for fund inflows but there are signs that investors are returning to the financial markets