Exercising prudence in Prudential
The market in Prudential shares has come up against resistance. Is it time to take profits? John C Burford explores the charts.
Get the latest financial news, insights and expert analysis from our award-winning MoneyWeek team, to help you understand what really matters when it comes to your finances.
You are now subscribed
Your newsletter sign-up was successful
Want to add more newsletters?

Twice daily
MoneyWeek
Get the latest financial news, insights and expert analysis from our award-winning MoneyWeek team, to help you understand what really matters when it comes to your finances.

Four times a week
Look After My Bills
Sign up to our free money-saving newsletter, filled with the latest news and expert advice to help you find the best tips and deals for managing your bills. Start saving today!
In my postof 8 April, I showed what could be done with a chart of an individual share in this case Prudential(LSE: PRU). Remember, I will only analyse large cap issues because they are subject to far fewer nasty shocks than are small caps.
Large cap shares often display beautiful Elliott wave patterns, excellent tramlines and even accurate Fibonacci targets.
When I find one of these, I will put it on my watch list, and even trade it when I can find a high prob/low risk entry.
MoneyWeek
Subscribe to MoneyWeek today and get your first six magazine issues absolutely FREE

Sign up to Money Morning
Don't miss the latest investment and personal finances news, market analysis, plus money-saving tips with our free twice-daily newsletter
Don't miss the latest investment and personal finances news, market analysis, plus money-saving tips with our free twice-daily newsletter
But UK shares do not trade 24 hours, as do my usual markets, and so opening gaps can give you a major headache, especially when the market opens way past your protective stop!
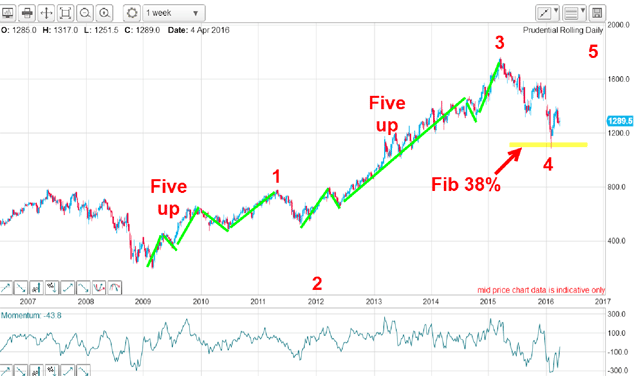
In the case of Prudential, I had these Elliott wave labels on the multi-year chart:

The market was in a clear fourth wave down off the 2015 high and the form wasan A-B-C, which is always a corrective pattern that told me that the major trend was still up.
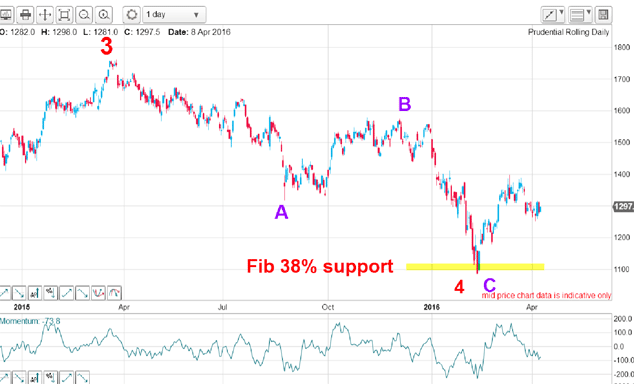
And this was the daily chart of the wave 4 pattern I showed:

This is what I wrote then: "The rally to mid-March is either wave 1 of a five up or wave A of an A-B-C. And the dip to wave 2 or B carried to the Fibonacci 38% level! That makes three separate 38% retraces. I did say that level was an important one.
"The path of least resistance seems to be up and directly ahead there is a large gap. Remember, gaps do tend to be filled (eventually) and this one is my immediate target.
"The other point about gaps is that once filled, the market usually recoils back the way it came and that is what I expect here. That will be a supreme test of my wave 5 up idea.
"But now, a long position taken near the wave C of 4 low can be protected by moving the protective stop to the entry point. That is a good place because if the market does decline to it, it would immediately cancel out my wave 5 idea and the market would likely decline below the previous wave 4 low."
So my immediate outlook was for a continuation of the rally off the February low.
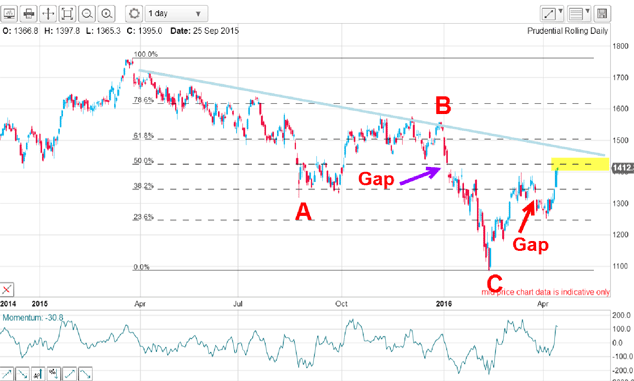
Here is the daily chart updated:

As I suggested, the immediate gap has now been closed (red arrow) and the market is knocking on the door of the earlier gap (purple arrow).
With that, the market has moved up from the C wave low by 22% - and handed a perceptive trader a fat running gain.
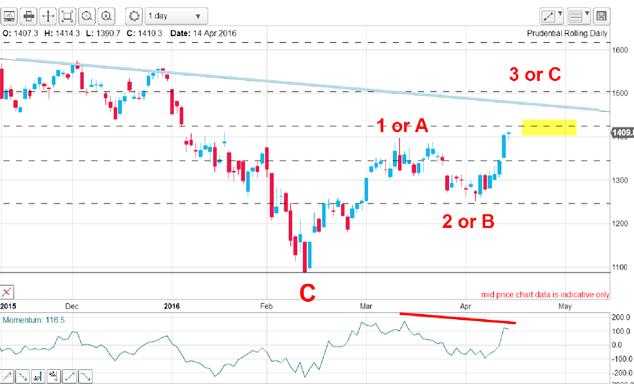
But now, I must give some thought to managing the trade. Here is a close-up:

Using an Elliott Wave rule, when an A-B-C correction has played out, the main trend resumes and the next move will be a small scale five up in the direction of that trend. That implies I expect the pattern shown is the start of that five up.
But as in life, there are always alternative paths. If the decline off the 2015 high has not completed and my C wave label at the February low is incorrect, the rally off it could be an A-B-C instead, leading to a resumption of the downtrend. That is why I placed these alternative labels on the current rally.
In any case, with this week's rally above the March high, I have the condition to consider the rally alive. But how far could it carry?
The Fibonacci 50% retrace of the C wave lies directly ahead. I have also drawn in a potential tramline off the 2014 high, which should also represent resistance.
With these two resistance levels, further upside progress might be difficult. Also, I have a momentum divergence building. Hmm.
They say that you never go poor taking a profit, so is this a good place to do just that?
Get the latest financial news, insights and expert analysis from our award-winning MoneyWeek team, to help you understand what really matters when it comes to your finances.
John is is a British-born lapsed PhD physicist, who previously worked for Nasa on the Mars exploration team. He is a former commodity trading advisor with the US Commodities Futures Trading Commission, and worked in a boutique futures house in California in the 1980s.
He was a partner in one of the first futures newsletter advisory services, based in Washington DC, specialising in pork bellies and currencies. John is primarily a chart-reading trader, having cut his trading teeth in the days before PCs.
As well as his work in the financial world, he has launched, run and sold several 'real' businesses producing 'real' products.
-
 Average UK house price reaches £300,000 for first time, Halifax says
While the average house price has topped £300k, regional disparities still remain, Halifax finds.
-
 Barings Emerging Europe trust bounces back from Russia woes
Barings Emerging Europe trust has added the Middle East and Africa to its mandate, delivering a strong recovery, says Max King