Everyone now loves gold – is that a warning?
You will be hard-pressed to find a gold bear. Is that a sign the market is ripe for turning? John C Burford surveys the charts.
Get the latest financial news, insights and expert analysis from our award-winning MoneyWeek team, to help you understand what really matters when it comes to your finances.
You are now subscribed
Your newsletter sign-up was successful
Want to add more newsletters?

Twice daily
MoneyWeek
Get the latest financial news, insights and expert analysis from our award-winning MoneyWeek team, to help you understand what really matters when it comes to your finances.

Four times a week
Look After My Bills
Sign up to our free money-saving newsletter, filled with the latest news and expert advice to help you find the best tips and deals for managing your bills. Start saving today!
In my last post on gold on 19 February, I related how hedge funds were caught totally flat-footed by gold's sharp rally off the December $1,050 lows. And that rally was fuelled by frantic short covering by the trend-following hedgies. Hedge funds had bet so heavily on continued price falls they had accumulated a record net short futures position a scenario that was unprecedented.
Traders who were alert to this tendency of hedge funds to accumulate huge wrong-way bets at major turns are being well rewarded as we are.
In just two months, gold has rocketed by around $200 and this move was well flagged in my postsat the time.
MoneyWeek
Subscribe to MoneyWeek today and get your first six magazine issues absolutely FREE

Sign up to Money Morning
Don't miss the latest investment and personal finances news, market analysis, plus money-saving tips with our free twice-daily newsletter
Don't miss the latest investment and personal finances news, market analysis, plus money-saving tips with our free twice-daily newsletter
And now the whole world knows that gold is in a huge bull market with copious bullish headlines in the media proclaiming it in recent days. And that fact has my headline indicator (HI) flashing strong amber.
From the manifestly bearish press gold was receiving from the medialast year, it has taken a $200 rally to get them to notice and to bring out headlines such as this one in last week's Telegraph: "Gold soars into bull market as global growth fears mount."
Today, with every shoeshine boy and his dog now tipping gold, my question is this: Is gold due an imminent pull-back? And if so, how low is it likely to go?
In other words, have too many bulls jumped over to one side of the boat leaving it in danger of capsizing?
Also, I have yet to read a single bearish article on gold in recent days surely a sign that the bullish enthusiasm may have run ahead of itself.
To help answer my question, here is the latest Commitments of traders (COT) data as of last Tuesday:
| (Contracts of 100 troy ounces) | Row 0 - Cell 1 | Row 0 - Cell 2 | Row 0 - Cell 3 | Open interest: 701,954 | ||||
| Commitments | ||||||||
| 248,418 | 64,802 | 186,421 | 211,142 | 413,891 | 645,981 | 665,114 | 55,973 | 36,840 |
| Changes from 02/23/16 (Change in open interest: -31,925) | ||||||||
| 2,016 | -2,621 | -15,621 | -18,961 | -13,125 | -32,566 | -31,368 | 641 | -558 |
| Percent of open in terest for each category of traders | ||||||||
| 35.4 | 9.2 | 26.6 | 30.1 | 59.0 | 92.0 | 94.8 | 8.0 | 5.2 |
| Number of traders in each category (Total traders: 392) | ||||||||
| 214 | 101 | 137 | 53 | 64 | 313 | 259 | Row 8 - Cell 7 | Row 8 - Cell 8 |
The hedge funds (non-commercials) have massively increased their long bets in the past two months from a net short position to the current plurality of four to one bullish. That is a massive swing in sentiment and supports my idea that a pull-back is very likely due.
Many bullish traders will be eyeing their juicy gains realised in such a short time and will be itching to take profits.
But what does the chart tell me about the likelihood of a corrective move?
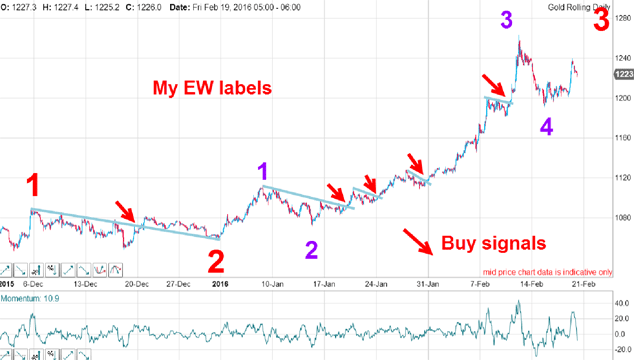
This was the hourly chart I showed last time. It shows my Elliott wave label roadmap:

The market was in a large red wave 3 up and within that wave, a five up was forming with the final wave 5 purple up ahead. The market had suffered a pull-back to purple wave 4 and was ready to move higher in purple wave 5.
And when this purple wave 5 ended, the red wave 3 would also terminate and the market would descend in a corrective red wave 4 (hopefully in an A-B-C).
That was the clear roadmap I had last month with a solid forecast for a move above the purple wave 3 high.
So has the market followed this plan?
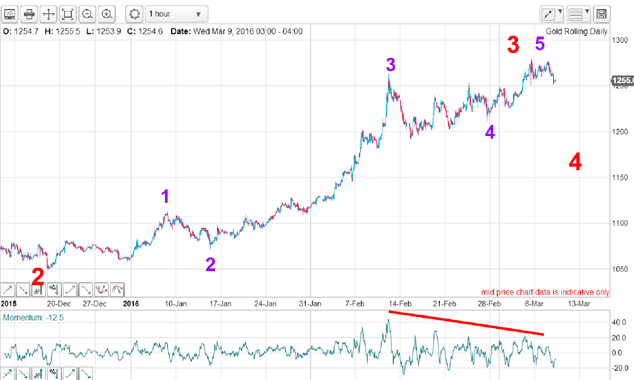
Here is the updated chart:

Right on cue, the market has moved higher above the purple wave 3 high and has totally confirmed my forecast. Now, I have a good candidate for my final purple wave 5 high.
Note the momentum divergence between the third and fifth wave highs. This divergence often occurs because fifth waves are generally weaker than third waves. They are usually driven by latecomers to the party who finally see what is happening. Third waves are generally driven by eager early bird bulls and of course frantic short covering by the bears in bull runs (long liquidation on bear runs).
So now, the market has followed my plan, will it now decline in a red wave 4?
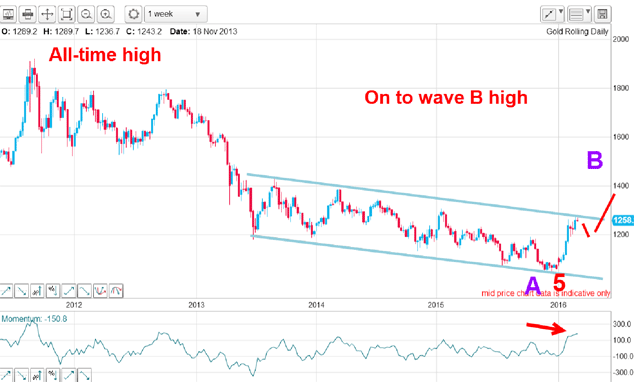
To put these waves into perspective, let's look at the longer term chart on the weekly:

I have marked the December $1,050 low as the final wave 5 low from the 2011 all-time high at $1,920. On the one larger scale, that five down is wave A of a potential A-B-C where the market is at the start of wave B.
But having hit major resistance at my upper tramline and with momentum very overbought (arrow), a pull-back appears highly likely. But how low could it go?
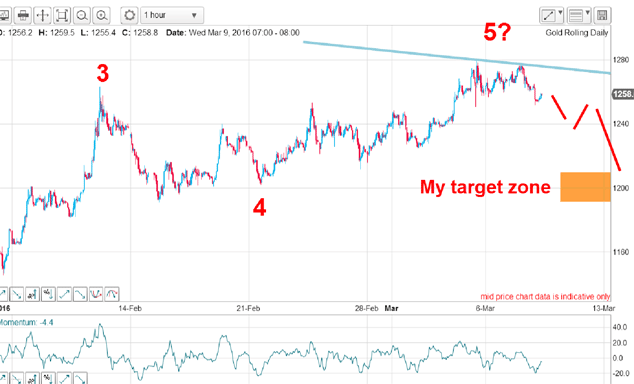
To get some clues, let's go back to the hourly chart:

If my wave 5 has indeed been put in (and that is not 100% certain, of course), the natural expectation is for an A-B-C decline to retrace part of the previous advance.
And a typical stopping place is the area of the wave 4 low of the previous five up. That places my target zone in the $1,200 area.
If that is indeed achieved, you can be sure the four to oneplurality of bullish hedge funds will be sharply reduced and bearish sentiment will re-emerge with headlines in the mediaappearing such as "Bulls run for cover as gold sinks" as the pendulum of sentiment weaves its magic in the markets.
Get the latest financial news, insights and expert analysis from our award-winning MoneyWeek team, to help you understand what really matters when it comes to your finances.
John is is a British-born lapsed PhD physicist, who previously worked for Nasa on the Mars exploration team. He is a former commodity trading advisor with the US Commodities Futures Trading Commission, and worked in a boutique futures house in California in the 1980s.
He was a partner in one of the first futures newsletter advisory services, based in Washington DC, specialising in pork bellies and currencies. John is primarily a chart-reading trader, having cut his trading teeth in the days before PCs.
As well as his work in the financial world, he has launched, run and sold several 'real' businesses producing 'real' products.
-
 ISA fund and trust picks for every type of investor – which could work for you?
Whether you’re an ISA investor seeking reliable returns, looking to add a bit more risk to your portfolio or are new to investing, MoneyWeek asked the experts for funds and investment trusts you could consider in 2026
-
 The most popular fund sectors of 2025 as investor outflows continue
It was another difficult year for fund inflows but there are signs that investors are returning to the financial markets