The Dow Jones returns to its old pattern
With the tides at their zenith, the Dow Jones changed onto a course last seen five years ago. John C Burford explains what that heralds for his next trade.
Get the latest financial news, insights and expert analysis from our award-winning MoneyWeek team, to help you understand what really matters when it comes to your finances.
You are now subscribed
Your newsletter sign-up was successful
Want to add more newsletters?

Twice daily
MoneyWeek
Get the latest financial news, insights and expert analysis from our award-winning MoneyWeek team, to help you understand what really matters when it comes to your finances.

Four times a week
Look After My Bills
Sign up to our free money-saving newsletter, filled with the latest news and expert advice to help you find the best tips and deals for managing your bills. Start saving today!
I am often asked if I would consider using any other method than tramlines, Elliott waves, and Fibonacci in my trading. The simple answer is: yes, if it helps me discover useful insights into market direction!
Every six months in March and September, I dust off my equinox indicator and see what it is telling me.
So, what is the equinox indicator? Has it anything to do with the arcane world of astrology?
MoneyWeek
Subscribe to MoneyWeek today and get your first six magazine issues absolutely FREE

Sign up to Money Morning
Don't miss the latest investment and personal finances news, market analysis, plus money-saving tips with our free twice-daily newsletter
Don't miss the latest investment and personal finances news, market analysis, plus money-saving tips with our free twice-daily newsletter
Whether it does or not, it is a curious fact that around the time of the spring and vernal equinox, the markets often take a significant turn in direction. In nature, tides are often at their highest around these times and therefore, the heights of tides are at tops or bottoms around the equinox.
And last week, the Dow made an all-time nominal high and is therefore a candidate for a top. But that is not all. Here is the weekly chart going back several years. Admire how the various prior pivot points (PPPs) were set years before:
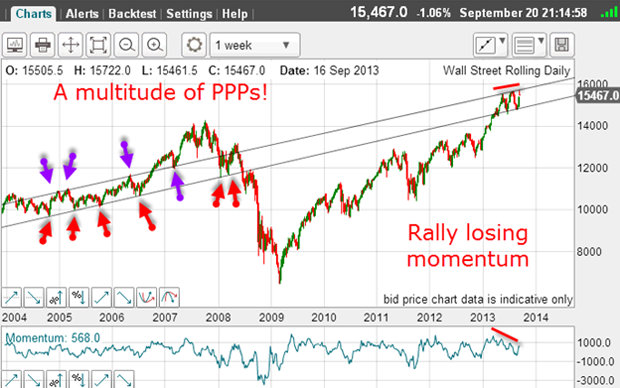
Since March this year at the time of the spring equinox the market has re-entered the trading channel, which has been empty for over five years.
If you need to prove to a friend that markets are patterned and have a memory, just show them this chart!
Also notable from the chart is the clear weakening of momentum while trading in the channel between the tramlines. That is a warning sign that the market may be ready to make a major reversal at any time.
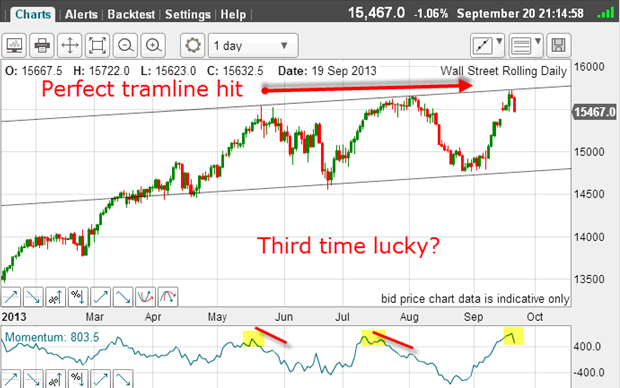
After the Fed's decision not to cut back on quantitative easing (QE) last Wednesday, the Dow exploded to the upside and created a gap.
Then the market hit the brick wall of the upper multi-year tramline on Thursday, and it was sent packing, and closed Friday just above the gap.
Gaps are very interesting when they occur which is rarely in the almost 24-hour trading world. Most of the time, gaps tend to be filled back in quite promptly.
And note the high momentum reading, in a region where previous tops were made. Note also the weakening momentum going into the highs, giving rise to large divergences, which is one of my biggest warning signals when looking for a turn.
Are hedge funds smart traders?
But here is the latest commitments of traders (COT) data for the mini Dow future:
| ($5 x DJIA Index) | Row 0 - Cell 1 | Row 0 - Cell 2 | Row 0 - Cell 3 | Open interest: 136,227 | ||||
| Commitments | ||||||||
| 37,990 | 7,877 | 4,811 | 76,834 | 99,705 | 119,635 | 112,393 | 16,592 | 23,834 |
| Changes from 09/10/13 (Change in open interest: 30,103) | ||||||||
| 13,305 | -2,254 | 4,752 | 12,208 | 24,197 | 30,265 | 26,695 | -162 | 3,408 |
| Percent of open interest for each category of traders | ||||||||
| 27.9 | 5.8 | 3.5 | 56.4 | 73.2 | 87.8 | 82.5 | 12.2 | 17.5 |
| Number of traders in each category (Total traders: 103) | ||||||||
| 30 | 17 | 17 | 45 | 27 | 84 | 55 | Row 8 - Cell 7 | Row 8 - Cell 8 |
This is the snapshot as of the close on Tuesday 17 September one day before the critical Fed announcement.
You can see that the hedge funds (non-commercials) filled their boots with longs (unlike the non-reportable small traders, who turned more bearish). The big boys were betting that the Fed would announce at worst only a slight reduction in QE support. It was to be business as usual.
Note the huge lop-sided position: the hedge funds are now almost five-to-one bullish.
But please don't take this raw data at face value hedge funds apply some very complex hedging strategies and not all of the positions shown in COT are solely directional bets.
And after the report the market rallied on the news that the Fed would not taper bond purchases soon, which took the Dow up to the upper tramline.
But then, on Friday, a Fed member broke ranks and suggested that the Fed would indeed start reducing QE soon. And that about turn brought out the selling.
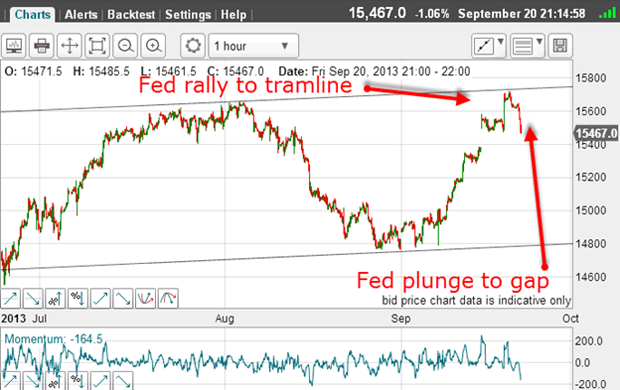
Isn't it remarkable that even with the extreme bullish reaction to Wednesday's news, the market could only make it to exactly my multi-year tramline before being slapped back down?
It was as if the market knew in advance there would be some less bullish developments a day later.
This is one more example of how trading solely on the news can be extremely hazardous to your wealth.
Hedge funds caught off-guard in Treasuries
But it is the ten-year Treasury note that is the main market since it drives many consumer rates.
And last week, the COT data was revealing:
| (Contracts of $100,000 face value) | Row 0 - Cell 1 | Row 0 - Cell 2 | Row 0 - Cell 3 | Open interest: 1,968,911 | ||||
| Commitments | ||||||||
| 173,420 | 299,446 | 47,240 | 1,494,089 | 1,201,201 | 1,714,749 | 1,547,887 | 254,162 | 421,024 |
| Changes from 09/10/13 (Change in open interest: -145,403) | ||||||||
| -19,704 | 20,998 | -9,607 | -138,655 | -122,394 | -167,966 | -111,003 | 22,563 | -34,400 |
| Percent of open in terest for each category of traders | ||||||||
| 8.8 | 15.2 | 2.4 | 75.9 | 61.0 | 87.1 | 78.6 | 12.9 | 21.4 |
| Number of traders in each category (Total traders: 300) | ||||||||
| 40 | 71 | 37 | 114 | 153 | 178 | 237 | Row 8 - Cell 7 | Row 8 - Cell 8 |
To back up their bullish stock bets, hedge funds also bet on Treasury yields rising (prices falling) as they expected the Fed to begin reducing their bond purchases.
That is why they swung massively to the bearish cause ahead of the report.
Here is the ten-year Treasury market's reaction to the Fed news:
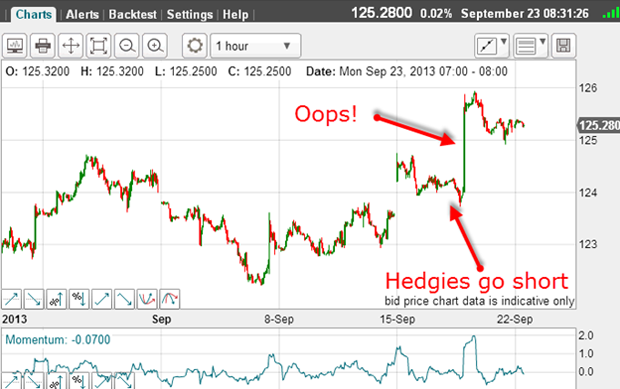
I call that a short squeeze of around 200 pips! For the longs, that was sweet.
Sadly, the COT data is released a few days after the snapshot and cannot be used for fine-tuning trade entries.
But it does show the current balance (or imbalance) in the market. This is invaluable information for those who know how to use it.
Get the latest financial news, insights and expert analysis from our award-winning MoneyWeek team, to help you understand what really matters when it comes to your finances.
John is is a British-born lapsed PhD physicist, who previously worked for Nasa on the Mars exploration team. He is a former commodity trading advisor with the US Commodities Futures Trading Commission, and worked in a boutique futures house in California in the 1980s.
He was a partner in one of the first futures newsletter advisory services, based in Washington DC, specialising in pork bellies and currencies. John is primarily a chart-reading trader, having cut his trading teeth in the days before PCs.
As well as his work in the financial world, he has launched, run and sold several 'real' businesses producing 'real' products.
-
 How a dovish Federal Reserve could affect you
Trump’s pick for the US Federal Reserve is not so much of a yes-man as his rival, but interest rates will still come down quickly, says Cris Sholto Heaton
-
 New Federal Reserve chair Kevin Warsh has his work cut out
Opinion Kevin Warsh must make it clear that he, not Trump, is in charge at the Fed. If he doesn't, the US dollar and Treasury bills sell-off will start all over again