Be bearish when markets rise - and bullish when they fall
To make decent profits from spread betting, you have to look at when market sentiment is building to extremes, then bet against the crowd. Here's one such trade that paid off.
Get the latest financial news, insights and expert analysis from our award-winning MoneyWeek team, to help you understand what really matters when it comes to your finances.
You are now subscribed
Your newsletter sign-up was successful
Want to add more newsletters?

Twice daily
MoneyWeek
Get the latest financial news, insights and expert analysis from our award-winning MoneyWeek team, to help you understand what really matters when it comes to your finances.

Four times a week
Look After My Bills
Sign up to our free money-saving newsletter, filled with the latest news and expert advice to help you find the best tips and deals for managing your bills. Start saving today!
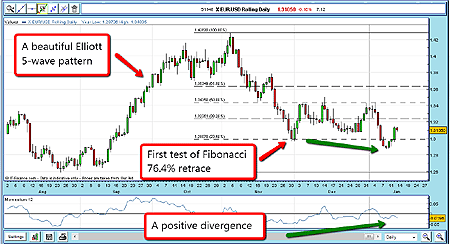
By now, if you have been following my trades, you'll be familiar with this daily chart of the EUR/USD (euro / US dollar) currency cross:

It shows the big bull market from August to November. This took the US dollar rate per euro from $1.26 to $1.43 - a 13% move. The 5-wave Elliott Wave pattern shows up very clearly, complete with a strong Wave 3, and a negative divergence with momentum at the Wave 5 top at 1.43. This move complies with all of the Elliott Wave rules.
And with five waves complete, I anticipated a reversal to the downside. (As I've noted before, a 5-Wave pattern typically heralds a change in trend - a 3-Wave is just a correction within a larger trend).
MoneyWeek
Subscribe to MoneyWeek today and get your first six magazine issues absolutely FREE

Sign up to Money Morning
Don't miss the latest investment and personal finances news, market analysis, plus money-saving tips with our free twice-daily newsletter
Don't miss the latest investment and personal finances news, market analysis, plus money-saving tips with our free twice-daily newsletter
True to form, the market embarked on a retreat. The EUR/USD rate fell rapidly to challenge, in late November, the Fibonacci 76.4% retrace (at $1.30) of the big move up. (This is highlighted on the chart above. In case you're wondering how I got this figure, I'm taking $1.26 as the starting point, then $1.43 as the high. That's a move of $0.17. 76.4% of that is just under $0.13 - subtract $0.13 from $1.43 and you get $1.30).
The market did bounce off this level. For the month of December, it traded in a wide range with no clear direction. That $1.30 level is, of course, a round-number. Many traders have noted that big round-numbers are often points where markets can reverse, or at least, make a decent bounce from. And that's what happened on 1 December - this was the first challenge of the $1.30 level.
Then, in early January, the market fell heavily to re-test the $1.30 level. And that's when I started to look for signs of a possible reversal.
The market gets over-excited
The degree of bearishness on the euro was becoming extreme in December. There was fevered talk of the eurozone breaking up, and of German resistance to funding the rescue plans. The bond prices of several nations were falling. No wonder the EUR/USD was dropping like a stone!
However, when the market did move beneath the $1.30 level on 7 January, I noted that momentum was falling - but it wasn't as weak as it was on the first move to $1.30. That means that a possible positive divergence was in the making.
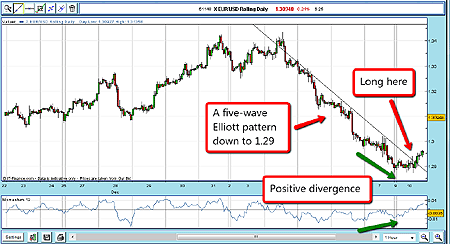
Also, the move down from $1.34 on 4 January was in a 5-wave move - and this also on a positive divergence on the hourly chart (see chart below).

As you'll recall, a 5-wave pattern heralds a change in trend. On 10 January, the market held the $1.2875 level three times, and then started to rally.
I decided to enter a long bet. I felt there were many buy-stops placed by the euro bears who were protecting their profits. That could move the market up. I entered a buy-stop to enter at $1.2950, and my risk I set at 80 pips, just under the low. This was within my 3% rule.
10 Jan Buy £2 Rolling EUR/USD @ 1.2950
Risk £160 (3% of account)
My order was now filled. My question was: what could possibly turn this market sharply higher? All seemed lost for the euro, did it not?
It's always darkest before the dawn
Well, the markets are living examples of that old saw: It's always darkest before the dawn.
Quite simply, the market had convinced itself that the euro was a lost cause. But the market was telling me that if sentiment was so extreme, a long bet offered pretty good odds. I was risking 3% of my account on this bet, so if I was wrong, my loss would be manageable.
I did question the prevailing opinion that Portugal would not be able to float its bonds successfully, which was the major worry point. After all, it is in the interests of many nations to prevent a total loss of confidence in the eurozone. A lot was riding on this auction, which was tiny by German standards.
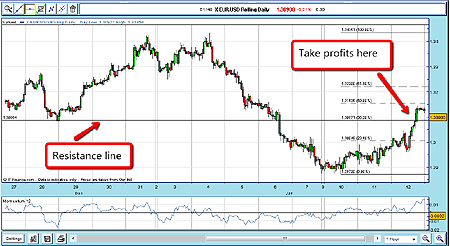
The technicals were lining up for a possible bounce, and I forecast that if the Portugal bond auction was not a disaster, a relief rally was on the cards. As it happened, on 12 January, the auction went off without incident, and the EUR/USD rallied. I then applied my Fibonacci tool to the 4-10 January dip to establish the likely targets to look to take profits.

Since I believed the rally would be short-lived - the market was in a bear market, after all - I would look to take profits near to a Fibonacci level where the momentum reading would be overbought.
Late on 12 January, the market pushed strongly through the Fibonacci 38.2% level at $1.31, and late in the day, I took my profits when momentum on the hourly chart was overbought.
12 Jan Sold £2 Rolling EUR/USD @ 1.3128
Profit £356 on risk of £160
That was a good two-day trade based upon reading the technicals plus the state of sentiment, leading to a change-of-trend trade. The key to this type of trading is to get positioned against the crowd, and look for signs of trend reversal.
Most traders get more and more bullish on rallies, and more and more bearish on declines. That is called the herding impulse - and we all have it. But as swing traders, where we are looking for short, sharp moves, we must override this impulse and become more bearish on rallies and more bullish on declines. It takes practice!
Get the latest financial news, insights and expert analysis from our award-winning MoneyWeek team, to help you understand what really matters when it comes to your finances.
John is is a British-born lapsed PhD physicist, who previously worked for Nasa on the Mars exploration team. He is a former commodity trading advisor with the US Commodities Futures Trading Commission, and worked in a boutique futures house in California in the 1980s.
He was a partner in one of the first futures newsletter advisory services, based in Washington DC, specialising in pork bellies and currencies. John is primarily a chart-reading trader, having cut his trading teeth in the days before PCs.
As well as his work in the financial world, he has launched, run and sold several 'real' businesses producing 'real' products.
-
 Can mining stocks deliver golden gains?
With gold and silver prices having outperformed the stock markets last year, mining stocks can be an effective, if volatile, means of gaining exposure
-
 8 ways the ‘sandwich generation’ can protect wealth
People squeezed between caring for ageing parents and adult children or younger grandchildren – known as the ‘sandwich generation’ – are at risk of neglecting their own financial planning. Here’s how to protect yourself and your loved ones’ wealth.