Are the bond vigilantes waking up?
Are US bond yields about to soar and how will the stock market react? John C Burford examines the charts for clues.
Get the latest financial news, insights and expert analysis from our award-winning MoneyWeek team, to help you understand what really matters when it comes to your finances.
You are now subscribed
Your newsletter sign-up was successful
Want to add more newsletters?

Twice daily
MoneyWeek
Get the latest financial news, insights and expert analysis from our award-winning MoneyWeek team, to help you understand what really matters when it comes to your finances.

Four times a week
Look After My Bills
Sign up to our free money-saving newsletter, filled with the latest news and expert advice to help you find the best tips and deals for managing your bills. Start saving today!
If there is one belief of most traders I wish I could change, it is this: ditch the idea that it is the news that makes sentiment, which makes the market. Most believe that if the news turns out good, that creates a bullish feeling.
In fact, it is almost the complete reverse. This is the way the market works: sentiment makes the market, which makes the news.
One of the most useful additional inputs to my tramline trading method is the COT (commitments of traders) data. This is a Pandora's box of goodies that shines a light on the shifting patterns of market sentiment.
MoneyWeek
Subscribe to MoneyWeek today and get your first six magazine issues absolutely FREE

Sign up to Money Morning
Don't miss the latest investment and personal finances news, market analysis, plus money-saving tips with our free twice-daily newsletter
Don't miss the latest investment and personal finances news, market analysis, plus money-saving tips with our free twice-daily newsletter
It is a snapshot of where traders have put their money according to whether they feel bullish or bearish. And it is this to-and-fro of sentiment that creates the price waves traced out on the price charts.
So today, I want to show you how I measure sentiment and what it is telling us about the current bull market.
This bullish mania will end in tears
How can the process be otherwise when a few days ago, the important news item emerged that US GDP had declined by a stunning 2.9% in quarter one. This was totally unexpected by the vast majority, including expert economists and pundits of all stripes.
On the face of it, this was a very bearish news item as it indicated a very sharp decline in activity. A visitor from Mars would have expected sharp falls in stocks.
So, what was the stock market's actual reaction? It rallied! Yes, despite the big miss, the experts were quick to dismiss the data as a quirk' (because of the bad weather).
You see, there are none so blind as those that will not see. And that little example confirms to me that the stock market is still gripped by a bullish mania that will end in floods of tears. The sentiment towards stocks remains manically bullish.
How to measure sentiment
We have the various surveys I have mentioned previously, which are very illuminating, especially at extremes.
For instance, the AAII (American Association of Individual Investors organisation carries out weekly surveys of its members for their views over the next six months of the stock markets. This is a very good overall take on the sentiment of the small retail US investor, and is published weekly.
The latest reading shows that the bullish percentage is at the long-term average, but the bearish sentiment is eight percentage points below its long-term average.
It has been noted that the small US investor, having been burned in the collapse of 2007-2009, has been reluctant to buy back in. It is the money managers that have been the major buyers in the past few years until recently.
An amazing study from Jeffrey Kleintop of LPL Financial finds that individuals and corporations (stock buy-backs) are now the only net buyers of equities. All other groups, such as hedge funds and pension funds are now net sellers.
The conclusion: only individuals and corporations are bullish, everyone else is bearish.
My imaginary sentiment gauge
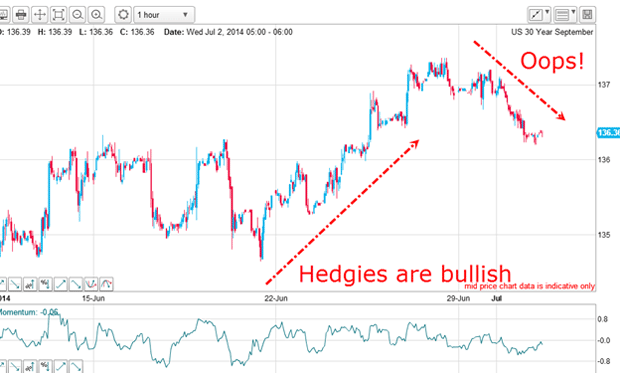
Last Wednesday, I noted the example of how, when hedgies become too excited by herding into the bullish camp, they are often disappointed. I used the example of the T-Bond market and this was the chart I showed:

The COT data showed a huge swing to the bullish side and that buying moved the market up to the 137.50 high.
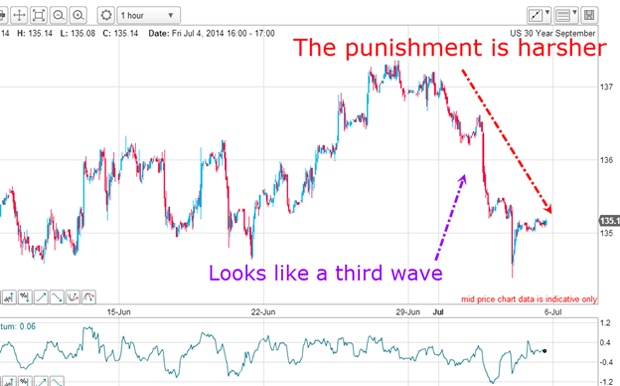
But by last Wednesday, the market started to punish the new converts by selling off. And by Friday, the punishment became even harsher as the market fell a lot further:

On this rally, was the bullish camp expanding just prior to this break?
| (Contracts of $100,000 face value) | Row 0 - Cell 1 | Row 0 - Cell 2 | Row 0 - Cell 3 | Open interest: 736,293 | ||||
| Commitments | ||||||||
| 88,817 | 71,080 | 6,828 | 488,290 | 490,637 | 583,935 | 568,545 | 152,358 | 167,748 |
| Changes from 06/24/14 (Change in open interest: -2,804) | ||||||||
| 10,808 | 2,893 | -3,948 | -7,451 | -7,988 | -591 | -9,043 | -2,213 | 6,239 |
| Percent of open in terest for each category of traders | ||||||||
| 12.1 | 9.7 | 0.9 | 66.3 | 66.6 | 79.3 | 77.2 | 20.7 | 22.8 |
| Number of traders in each category (Total traders: 170) | ||||||||
| 30 | 28 | 13 | 73 | 85 | 110 | 119 | Row 8 - Cell 7 | Row 8 - Cell 8 |
As you can see in the chart above, the hedgies (non-commercials) certainly added to their bullish positions since, being trend-followers, they believed a bullish trend was getting started. Interestingly, the small traders (non-reportables) read the market correctly and turned slightly more bearish.
The bellwether of the US economy
Traditionally, it has always been the bond market, rather than the stock market, that has been the more accurate bellwether of the US economy.
A mysterious group called the bond vigilantes are said to stalk the markets, keeping excesses in check. They have been strangely inactive over the past few years, allowing massive bubbles to form. Are they about to assert their power once again?
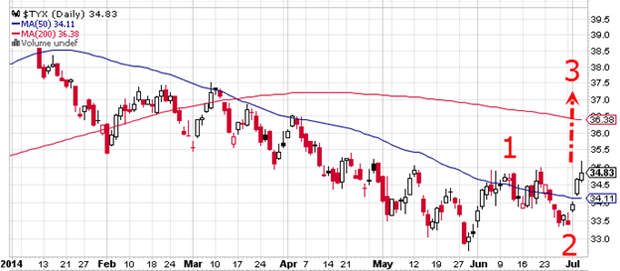
On the charts, it appears Treasury yields are at the start of a third wave up:

Yields move inversely to prices, of course. If this count is correct, we shall see a rapid move up in yields. What will be the reaction of the stock market? It will almost certainly not be pretty (for the bulls, that is).
Get the latest financial news, insights and expert analysis from our award-winning MoneyWeek team, to help you understand what really matters when it comes to your finances.
John is is a British-born lapsed PhD physicist, who previously worked for Nasa on the Mars exploration team. He is a former commodity trading advisor with the US Commodities Futures Trading Commission, and worked in a boutique futures house in California in the 1980s.
He was a partner in one of the first futures newsletter advisory services, based in Washington DC, specialising in pork bellies and currencies. John is primarily a chart-reading trader, having cut his trading teeth in the days before PCs.
As well as his work in the financial world, he has launched, run and sold several 'real' businesses producing 'real' products.
-
 Average UK house price reaches £300,000 for first time, Halifax says
While the average house price has topped £300k, regional disparities still remain, Halifax finds.
-
 Barings Emerging Europe trust bounces back from Russia woes
Barings Emerging Europe trust has added the Middle East and Africa to its mandate, delivering a strong recovery, says Max King