Advice to traders: Keep it simple, stupid
Experts often over-complicate things in their analysis of the markets, says John C Burford. Keep it simple, and trust your trading methods.
Get the latest financial news, insights and expert analysis from our award-winning MoneyWeek team, to help you understand what really matters when it comes to your finances.
You are now subscribed
Your newsletter sign-up was successful
Want to add more newsletters?

Twice daily
MoneyWeek
Get the latest financial news, insights and expert analysis from our award-winning MoneyWeek team, to help you understand what really matters when it comes to your finances.

Four times a week
Look After My Bills
Sign up to our free money-saving newsletter, filled with the latest news and expert advice to help you find the best tips and deals for managing your bills. Start saving today!
On Monday, I mentioned a wonderfully readable book: Thinking, Fast and Slow, written by a Nobel-winning economist and psychologist Daniel Kahneman.
In it, the author explains that we have two modes of thinking: fast and slow. The fast mode produces the instinctive gut-reactions, while the slow mode oversees and modifies the fast mode and relies on rational effort to make predictions.
There is so much in the book that is directly applicable to trading, and how to approach it. The key takeaway for me is that to be a great trader, you had better get an understanding of exactly how you make your decisions in other words, do you use the gut feel of System 1, or the more considered System 2 (or a combination)?
MoneyWeek
Subscribe to MoneyWeek today and get your first six magazine issues absolutely FREE

Sign up to Money Morning
Don't miss the latest investment and personal finances news, market analysis, plus money-saving tips with our free twice-daily newsletter
Don't miss the latest investment and personal finances news, market analysis, plus money-saving tips with our free twice-daily newsletter
Kahneman has demonstrated that many experiments have proved that experts are no better at predicting events than the application of simple algorithms that take personal feelings and judgments out of the process.
In fact, they are very often worse performers than a simple formula. This is especially relevant to trading, is it not? We are dealing with an uncertain future, after all.
Today, I want to explore this idea and to show that Kahneman's findings back up my own approach to trading by using only a few basic inputs (using the 'kiss' principle keep it simple, stupid).
The best way to predict an outcome
In one classic study, trained counsellors predicted the grades of 'freshman' (first-year university students) at the end of their first year. The counsellors interviewed each student for 45 minutes, and they also had access to high school grades, several aptitude test results and a four-page personal statement.
The statistical algorithm used only two inputs - the high school grades and one aptitude test. This was a fraction of the amount of information available to the counsellors.
And guess what? The formula was more accurate than 11 of the 14 expert counsellors!
Meehl also found similar patterns in forecasting violations of parole, pilot training and criminal recidivism.
Another researcher found a similar result in the prediction of which Bordeaux wines would become great vintages the experts were beaten by a simple formula.
Basically, all of this research showed that the application of a simple formula based on known statistics or common sense are very good predictors of outcomes and usually much better than the experts, who regularly over-complicate things by virtue of their extensive knowledge.
A Nobel laureate endorses my methods
I guess that validates my view that you should only read what financial gurus have to say for entertainment purposes. And it is entirely rational to be skeptical towards experts' opinions.
And what does this research say about the usefulness of the learned research carried out by money managers in support of their investment decisions? The back of an envelope could safely replace these tomes. But they have to maintain the illusion that they have done some valuable work, of course.
According to Bloomberg, the skill of US mutual fund managers contribute just 0.03% to performance a minuscule figure compared with expenses. There are now more than 7,500 mutual funds 14 times the number in 1979. Competition is fierce, yet only 20% of funds have beaten the S&P index in the past three years.
Wouldn't you think that with all those brains and research tools at their disposal that many more could beat the market? The success of the mutual fund industry is a triumph of marketing over performance.
For me, keeping it simple is paramount. I use only one technical indicator the basic 12-period momentum. And I only take note of it when it becomes extended and produces a divergence with price.
I realise the trend today is to use many different indicators on your charts. I have known some system to use over six different indicators on the same chart. How anyone can see the woods for the trees is beyond me.
But I have a comforting thought my simplistic approach is endorsed by a Nobel prize winner!
This is the real Great Rotation
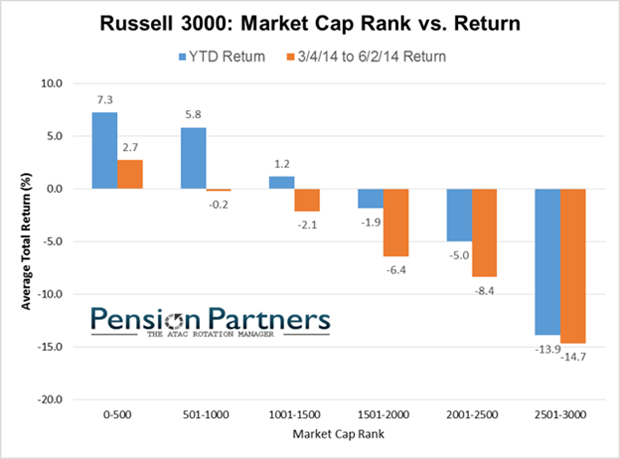
Not only that, but there is a huge divergence between shares depending on their capitalisation. Basically, the highest cap issues are making the new highs and the small caps are sinking. Here is an amazing chart:

(Chart courtesy of Pension Partners LLC)
The Russell 3000 has been separated into bands of the 50 largest caps down to the smallest from left to right. The chart shows the year-to-date (YTD) return (blue bar) where the biggest returns are in the 50 largest caps (at +7%). Returns then slide down to the weakest (at -14%) for the smallest caps. Isn't that pretty? But note the massive differential at over 20%.
This is the real Great Rotation out of risky small caps and into the safe big boys. I cannot recall ever seeing such a wide disparity.
What does this signify? One thing it doesn't indicate is that the stock market is a healthy one. When money flows out of small caps into large caps, investors are seeking safety and dividends a conservative approach. Risk is turning off.
The FTSE is looking interesting

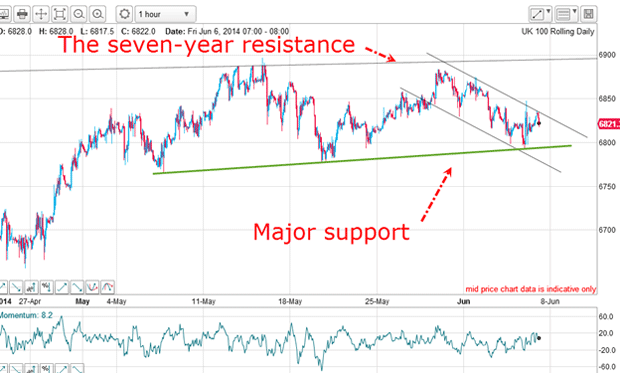
The FTSE has not followed the US indexes into new high ground and is testing major support. My upper line is the seven-year resistance line from the 2007 highs. This resistance is super-strong - note the overshoot in mid-May as the market tried to push above it. That was bearish action.
If my green support line gives way, that could spell the end of the big bull market and put in a nice head and shoulders on the hourly.
And also note that if the top is in, it will turn out to be a diffuse affair with many corrective waves, making it very tough to trade. Pin-point precision for trade entries is essential when trading stock-market tops.
Get the latest financial news, insights and expert analysis from our award-winning MoneyWeek team, to help you understand what really matters when it comes to your finances.
John is is a British-born lapsed PhD physicist, who previously worked for Nasa on the Mars exploration team. He is a former commodity trading advisor with the US Commodities Futures Trading Commission, and worked in a boutique futures house in California in the 1980s.
He was a partner in one of the first futures newsletter advisory services, based in Washington DC, specialising in pork bellies and currencies. John is primarily a chart-reading trader, having cut his trading teeth in the days before PCs.
As well as his work in the financial world, he has launched, run and sold several 'real' businesses producing 'real' products.
-
 ISA fund and trust picks for every type of investor – which could work for you?
Whether you’re an ISA investor seeking reliable returns, looking to add a bit more risk to your portfolio or are new to investing, MoneyWeek asked the experts for funds and investment trusts you could consider in 2026
-
 The most popular fund sectors of 2025 as investor outflows continue
It was another difficult year for fund inflows but there are signs that investors are returning to the financial markets
