A warning sign for stocks
In a classic example of herding behaviour, small investors have become very bullish on stocks. That could signal a turning point for the markets, says John C Burford.
Get the latest financial news, insights and expert analysis from our award-winning MoneyWeek team, to help you understand what really matters when it comes to your finances.
You are now subscribed
Your newsletter sign-up was successful
Want to add more newsletters?

Twice daily
MoneyWeek
Get the latest financial news, insights and expert analysis from our award-winning MoneyWeek team, to help you understand what really matters when it comes to your finances.

Four times a week
Look After My Bills
Sign up to our free money-saving newsletter, filled with the latest news and expert advice to help you find the best tips and deals for managing your bills. Start saving today!
Many think that summer is a bad time for stocks. "Sell in May and go away, don't come back till St Leger Day", as they say.
Although this was pretty good advice in many years before the great crash of 2008, since then stocks have actually risen in the summer months in every year of the past four, except in 2011.
So this particular trading rule has absolutely no value to me, based on its historical performance.
MoneyWeek
Subscribe to MoneyWeek today and get your first six magazine issues absolutely FREE

Sign up to Money Morning
Don't miss the latest investment and personal finances news, market analysis, plus money-saving tips with our free twice-daily newsletter
Don't miss the latest investment and personal finances news, market analysis, plus money-saving tips with our free twice-daily newsletter
For a swing trader, there are opportunities at all times of the year. And currently, there appears to be an interesting situation developing in stocks.
Interesting situation in the Dow
This brings up an interesting question regarding the Elliott wave count.
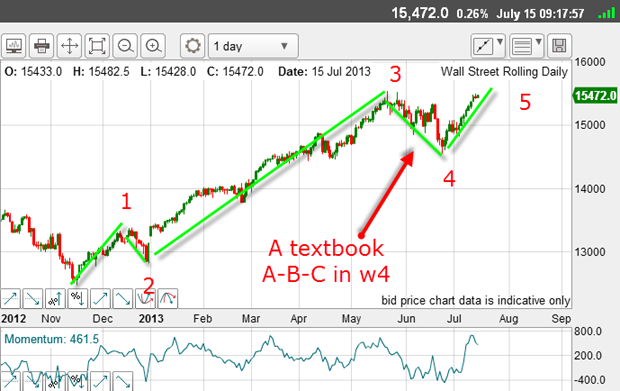
I have been using the following count off the November 2012 low:

From the wave 3 high on 22 May, wave 4 has declined in a clear A-B-C. So far - textbook.
And from the wave 4 low on 24 June, the rally is my wave 5 a final wave before the big decline sets in. And this 5 wave top should exceed the 3 wave top.
That is the roadmap I'll be using until I'm proven wrong.
But the question is this: has this final thrust done enough to call the end to this fifth wave? The closing high has exceeded the wave 3 closing high all right, but the absolute high of 15,540 has not yet been beaten.
The jury is still out on that, as there are no clear-cut rules in Elliott Wave theory to help decide.
But I have a further clue to help me.
What form should this final wave 5 take? Ideally, it too, should contain a clear five-wave form. Let's examine this final wave 5 in detail.
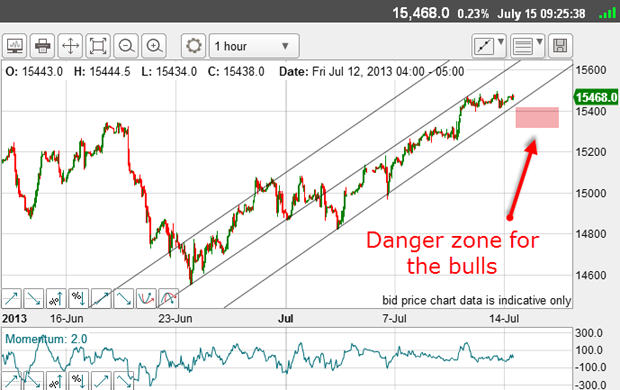
Here is the hourly chart from the 3 July low:

And I have drawn some impressive tramlines. My central tramline sports great touch points and several prior pivot points.
These are very reliable tramlines, so far.
Of course, a break below the lower tramline would be negative for the rally, but so long as this does not occur, the next target will be my central tramline in the 15,600 15,750 region.
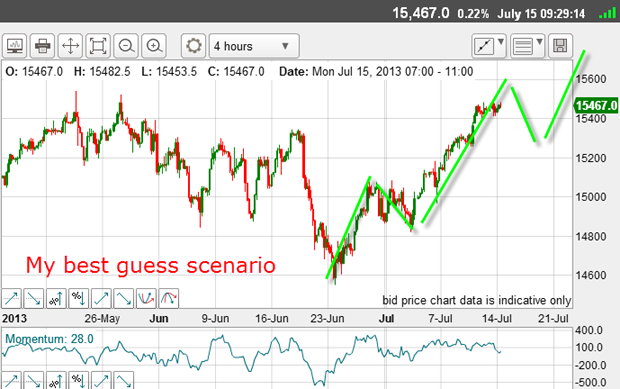
This sets up the likely Elliott wave labels here:

If the market can make it to the centre tramline, that should be wave 3 of the final wave 5 from the June low.
Then, a dip in wave 4 and finally, a new thrust up into new high ground for the final fifth wave, as shown, perhaps to my highest tramline in the 15,800 region.
That will be my roadmap for now. But I will watch carefully for a lower tramline break.
Herding in action?
| $5 X DJIA INDEX | Row 0 - Cell 1 | Row 0 - Cell 2 | Row 0 - Cell 3 | Open interest: 115,832 | ||||
| Commitments | ||||||||
| 43,682 | 7,976 | 551 | 46,348 | 83,990 | 90,581 | 92,517 | 15,099 | 13,163 |
| Changes from 2/7/13 (Change in open interest: 11,573) | ||||||||
| 5,255 | 3,669 | 81 | 5,010 | 6,481 | 10,346 | 10,231 | 1,227 | 1,342 |
| Percent of open in terest for each category of traders | ||||||||
| 41.3 | 7.5 | 0.5 | 43.9 | 79.5 | 85.7 | 87.5 | 14.3 | 12.5 |
| Number of traders in each category (Total traders: 98) | ||||||||
| 32 | 17 | 5 | 33 | 22 | 69 | 40 | Row 8 - Cell 7 | Row 8 - Cell 8 |
But ominously the small investor has suddenly become very bullish, after generally distrusting the four-year rally. The pros have been wildly bullish, while retail investors have been mostly neutral in the past four years.
Here is the latest AAII data:
| Row 0 - Cell 0 | 49% (up 7% on week) | 18% (down 6%) | 33% |
| Long-term average | 39% | 30% | 31% |
This is classic herding in action.
And this is what occurs at big market tops and why monitoring sentiment data such as this can help you pinpoint turns.
And using my tramline method can give you an edge in your timing a most essential component of successful trading.
Get the latest financial news, insights and expert analysis from our award-winning MoneyWeek team, to help you understand what really matters when it comes to your finances.
John is is a British-born lapsed PhD physicist, who previously worked for Nasa on the Mars exploration team. He is a former commodity trading advisor with the US Commodities Futures Trading Commission, and worked in a boutique futures house in California in the 1980s.
He was a partner in one of the first futures newsletter advisory services, based in Washington DC, specialising in pork bellies and currencies. John is primarily a chart-reading trader, having cut his trading teeth in the days before PCs.
As well as his work in the financial world, he has launched, run and sold several 'real' businesses producing 'real' products.
-
 MoneyWeek Talks: The funds to choose in 2026
Podcast Fidelity's Tom Stevenson reveals his top three funds for 2026 for your ISA or self-invested personal pension
-
 Three companies with deep economic moats to buy now
Opinion An economic moat can underpin a company's future returns. Here, Imran Sattar, portfolio manager at Edinburgh Investment Trust, selects three stocks to buy now