A textbook example of tramline trading in the euro market
John C Burford outlines a textbook example from the currency markets of how tramlines can help find entry and exit points for trades.
Get the latest financial news, insights and expert analysis from our award-winning MoneyWeek team, to help you understand what really matters when it comes to your finances.
You are now subscribed
Your newsletter sign-up was successful
Want to add more newsletters?

Twice daily
MoneyWeek
Get the latest financial news, insights and expert analysis from our award-winning MoneyWeek team, to help you understand what really matters when it comes to your finances.

Four times a week
Look After My Bills
Sign up to our free money-saving newsletter, filled with the latest news and expert advice to help you find the best tips and deals for managing your bills. Start saving today!
Following on from last Friday'spost on the turmoil in the euro, we are seeing my big moves ahead' prediction come to life this morning as the markets open.
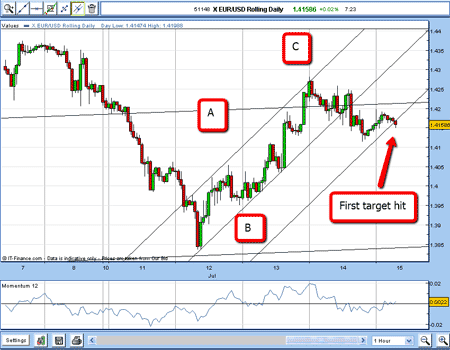
If you recall, the euro suffered a massive decline from the 1.46 to the 1.38 areas earlier in the month, and dropped right down to my lower tramline before staging a corrective bounce in an A-B-C format.
I was able to draw a nice tramline trio on this rally, and pointed to an area where short positions could have been taken at the wave C high.
MoneyWeek
Subscribe to MoneyWeek today and get your first six magazine issues absolutely FREE

Sign up to Money Morning
Don't miss the latest investment and personal finances news, market analysis, plus money-saving tips with our free twice-daily newsletter
Don't miss the latest investment and personal finances news, market analysis, plus money-saving tips with our free twice-daily newsletter
Here is the chart from last Friday:

(Click on the chart for a larger version)
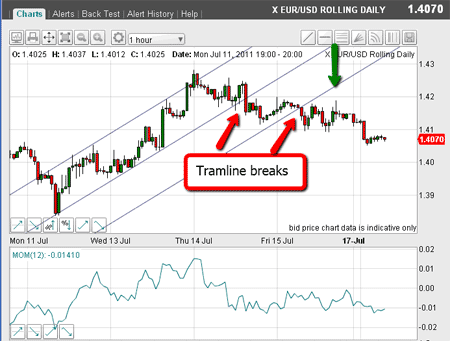
And this is the chart this morning (in case you're wondering, the slight change in the appearance of the charts is due to my spread betting provider upgrading their chart package over the weekend):

(Click on the chart for a larger version)
It shows the two tramline breaks leading lower.
On Friday, I explored an alternative tramline pair, and the lower one has now been broken.
Tramline breaks are signals to take positions using protective stops, of course.
A satisfying new set of tramlines
Now, with the wave C high established, at least for now, I can begin to look for another tramline set this time, containing the retreat from that high.
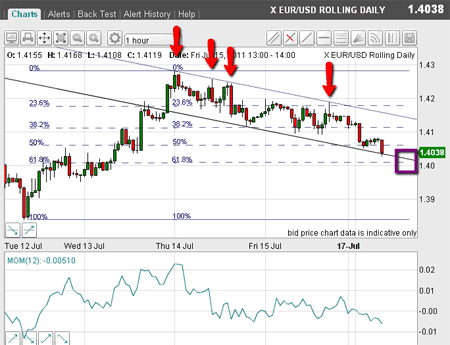
Using my trusty hourly chart, I can do just that and here are my tramlines:

(Click on the chart for a larger version)
The upper tramline was easy to draw! I have an exact fit to the tops marked by the red arrows. That is satisfying and validates my line placement.
Then, I took my parallel line generator and found that the lows, too, can be fitted to a tramline.
Currently, the market has retreated down to this line in the 1.4030 area.
I have also drawn my Fibonacci retracements of the A-B-C rally. Note how the market tried to hold the line at the 50% level, gave up, and is now heading for the 61.8% level, where it meets my lower tramline (marked by purple box).
So far, the market moves are impressively textbook.
Never forget the importance of protective stop losses
Since then,the market has moved down to my lower tramline. If I were a short-term trader, who shorted at around the wave C high in the 1.42 area, I would be looking to take profits here in the 1.4040 area for a 160 pip profit.
The momentum readings on the hourly chart are somewhat oversold and a solid tramline has been hit.
Near-term, I expect more backing and filling around my lower tramline.
Of course, the market could make a base here and make a move to my upper tramline.
If that were to occur, the odds would swing towards my alternative scenario, where my wave C would actually be a larger wave A, and then the current dip would be a new wave B, and the market would rally to a new high above 1.42.
I have a similar scenario in the Dow as given in my last Dow email: Profit from the Dow Jones whichever way it heads.
We must never rule out the alternative possibilities, and that is why management of protective stops is a crucial element of trading.
Conservative traders will be looking at the 12,550 level with interest!
Don't miss my next trading insight. To receive all my spread betting blog posts by email, as soon as I've written them, just sign up here .
Get the latest financial news, insights and expert analysis from our award-winning MoneyWeek team, to help you understand what really matters when it comes to your finances.
John is is a British-born lapsed PhD physicist, who previously worked for Nasa on the Mars exploration team. He is a former commodity trading advisor with the US Commodities Futures Trading Commission, and worked in a boutique futures house in California in the 1980s.
He was a partner in one of the first futures newsletter advisory services, based in Washington DC, specialising in pork bellies and currencies. John is primarily a chart-reading trader, having cut his trading teeth in the days before PCs.
As well as his work in the financial world, he has launched, run and sold several 'real' businesses producing 'real' products.
-
 ISA fund and trust picks for every type of investor – which could work for you?
Whether you’re an ISA investor seeking reliable returns, looking to add a bit more risk to your portfolio or are new to investing, MoneyWeek asked the experts for funds and investment trusts you could consider in 2026
-
 The most popular fund sectors of 2025 as investor outflows continue
It was another difficult year for fund inflows but there are signs that investors are returning to the financial markets