Most popular London boroughs: Full list of in-demand places to move to
A deluge of people move to or within Britain’s capital each year – but which area is the most popular? We look at the most in-demand London boroughs in 2025.


Get the latest financial news, insights and expert analysis from our award-winning MoneyWeek team, to help you understand what really matters when it comes to your finances.
You are now subscribed
Your newsletter sign-up was successful
Want to add more newsletters?

Twice daily
MoneyWeek
Get the latest financial news, insights and expert analysis from our award-winning MoneyWeek team, to help you understand what really matters when it comes to your finances.

Four times a week
Look After My Bills
Sign up to our free money-saving newsletter, filled with the latest news and expert advice to help you find the best tips and deals for managing your bills. Start saving today!
Droves of people move to or within the UK’s capital each year, whether it be for work, to study, or to be closer to family and friends.
With Greater London having an area of over 600 square miles and a population of around 9 million, there is a wide range of locations to choose from.
Home moving comparison site CompareMyMove crunched the data on over 23,000 home moves to find out where in London people have chosen to move between January and September 2025.
MoneyWeek
Subscribe to MoneyWeek today and get your first six magazine issues absolutely FREE

Sign up to Money Morning
Don't miss the latest investment and personal finances news, market analysis, plus money-saving tips with our free twice-daily newsletter
Don't miss the latest investment and personal finances news, market analysis, plus money-saving tips with our free twice-daily newsletter
The analysis found that movers by far favour South London when choosing where in the capital to move to, with the most popular borough being relatively close to the centre.
But the borough is not cheap – it commands rent and house prices above the London average of £543,497, according to Halifax.
We look at the most popular London boroughs to move to in 2025.
Most popular London boroughs in 2025
South London is by far the most in-demand area of the capital to move to, with CompareMyMove’s data showing seven of the ten most popular boroughs lie in the south.
Wandsworth
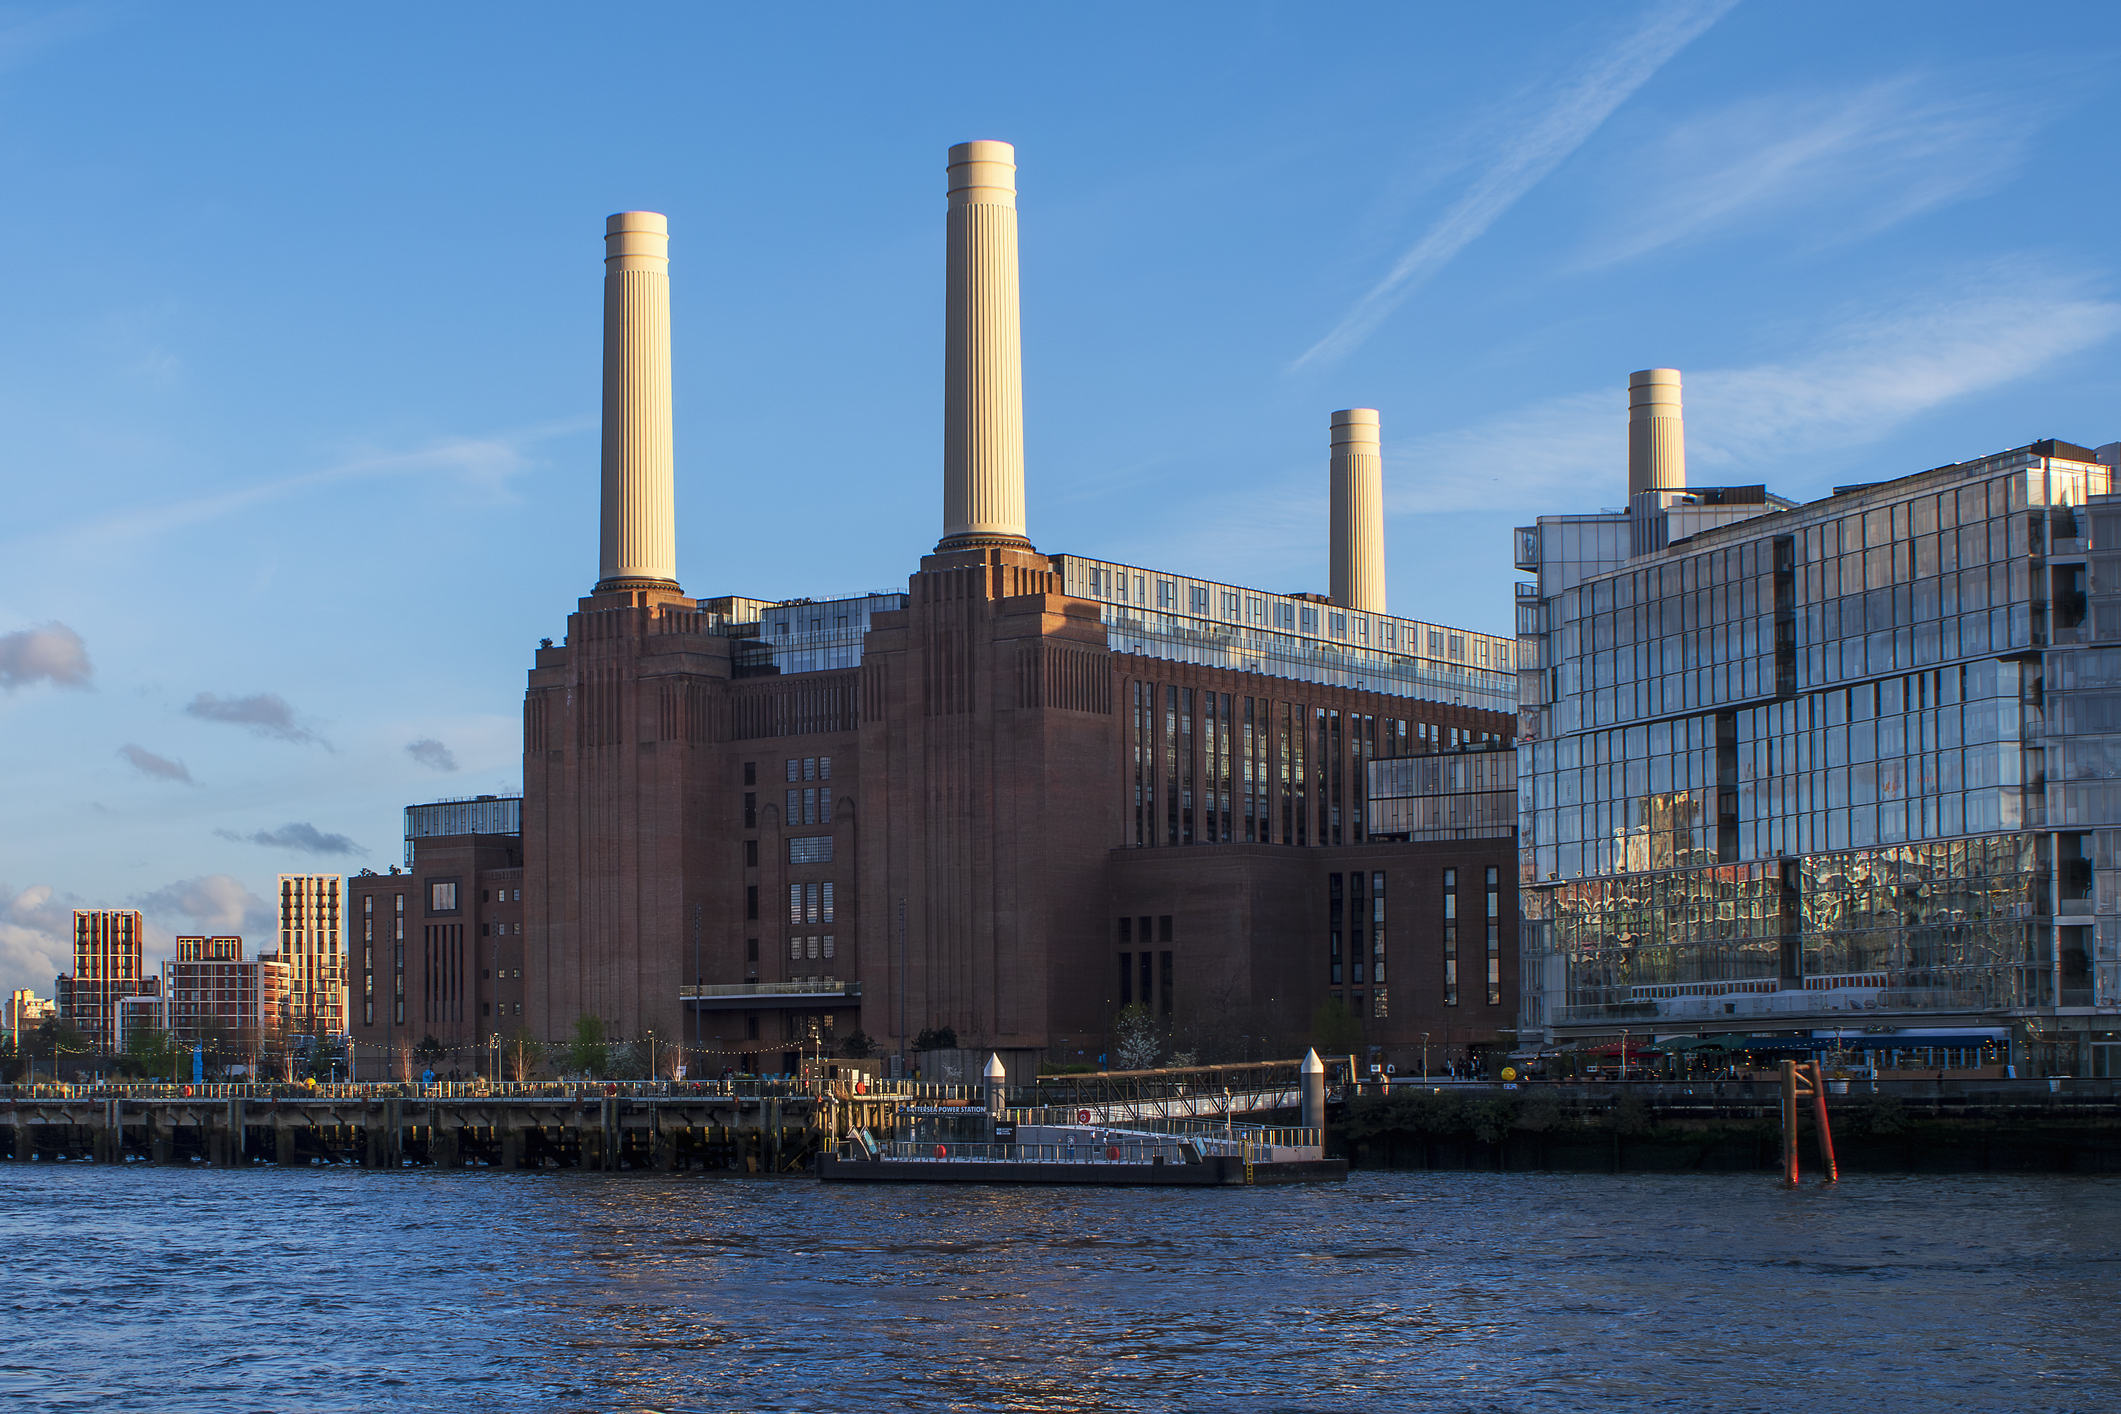
The most popular London borough to move to so far in 2025 was Wandsworth, with 4.76% of people moving to or within the capital going to this borough.
The borough is known for its leafy residential streets and large green spaces, and has been named the London Borough of Culture for 2025. It stretches from Battersea to Tooting and is home to around 329,677 people.
It is also home to Battersea Power Station, a decommissioned power station which was reopened as a shopping centre in 2022 and has become a major tourist attraction.
The average price of a house in Wandsworth is £691,000, far above the London average, while renters will pay an average of £2,526 a month to live there, according to the Office for National Statistics (ONS).
There is a silver lining though – residents of Wandsworth have the cheapest council tax rates in London, paying between £660 and £1,980 a year.
Tower Hamlets
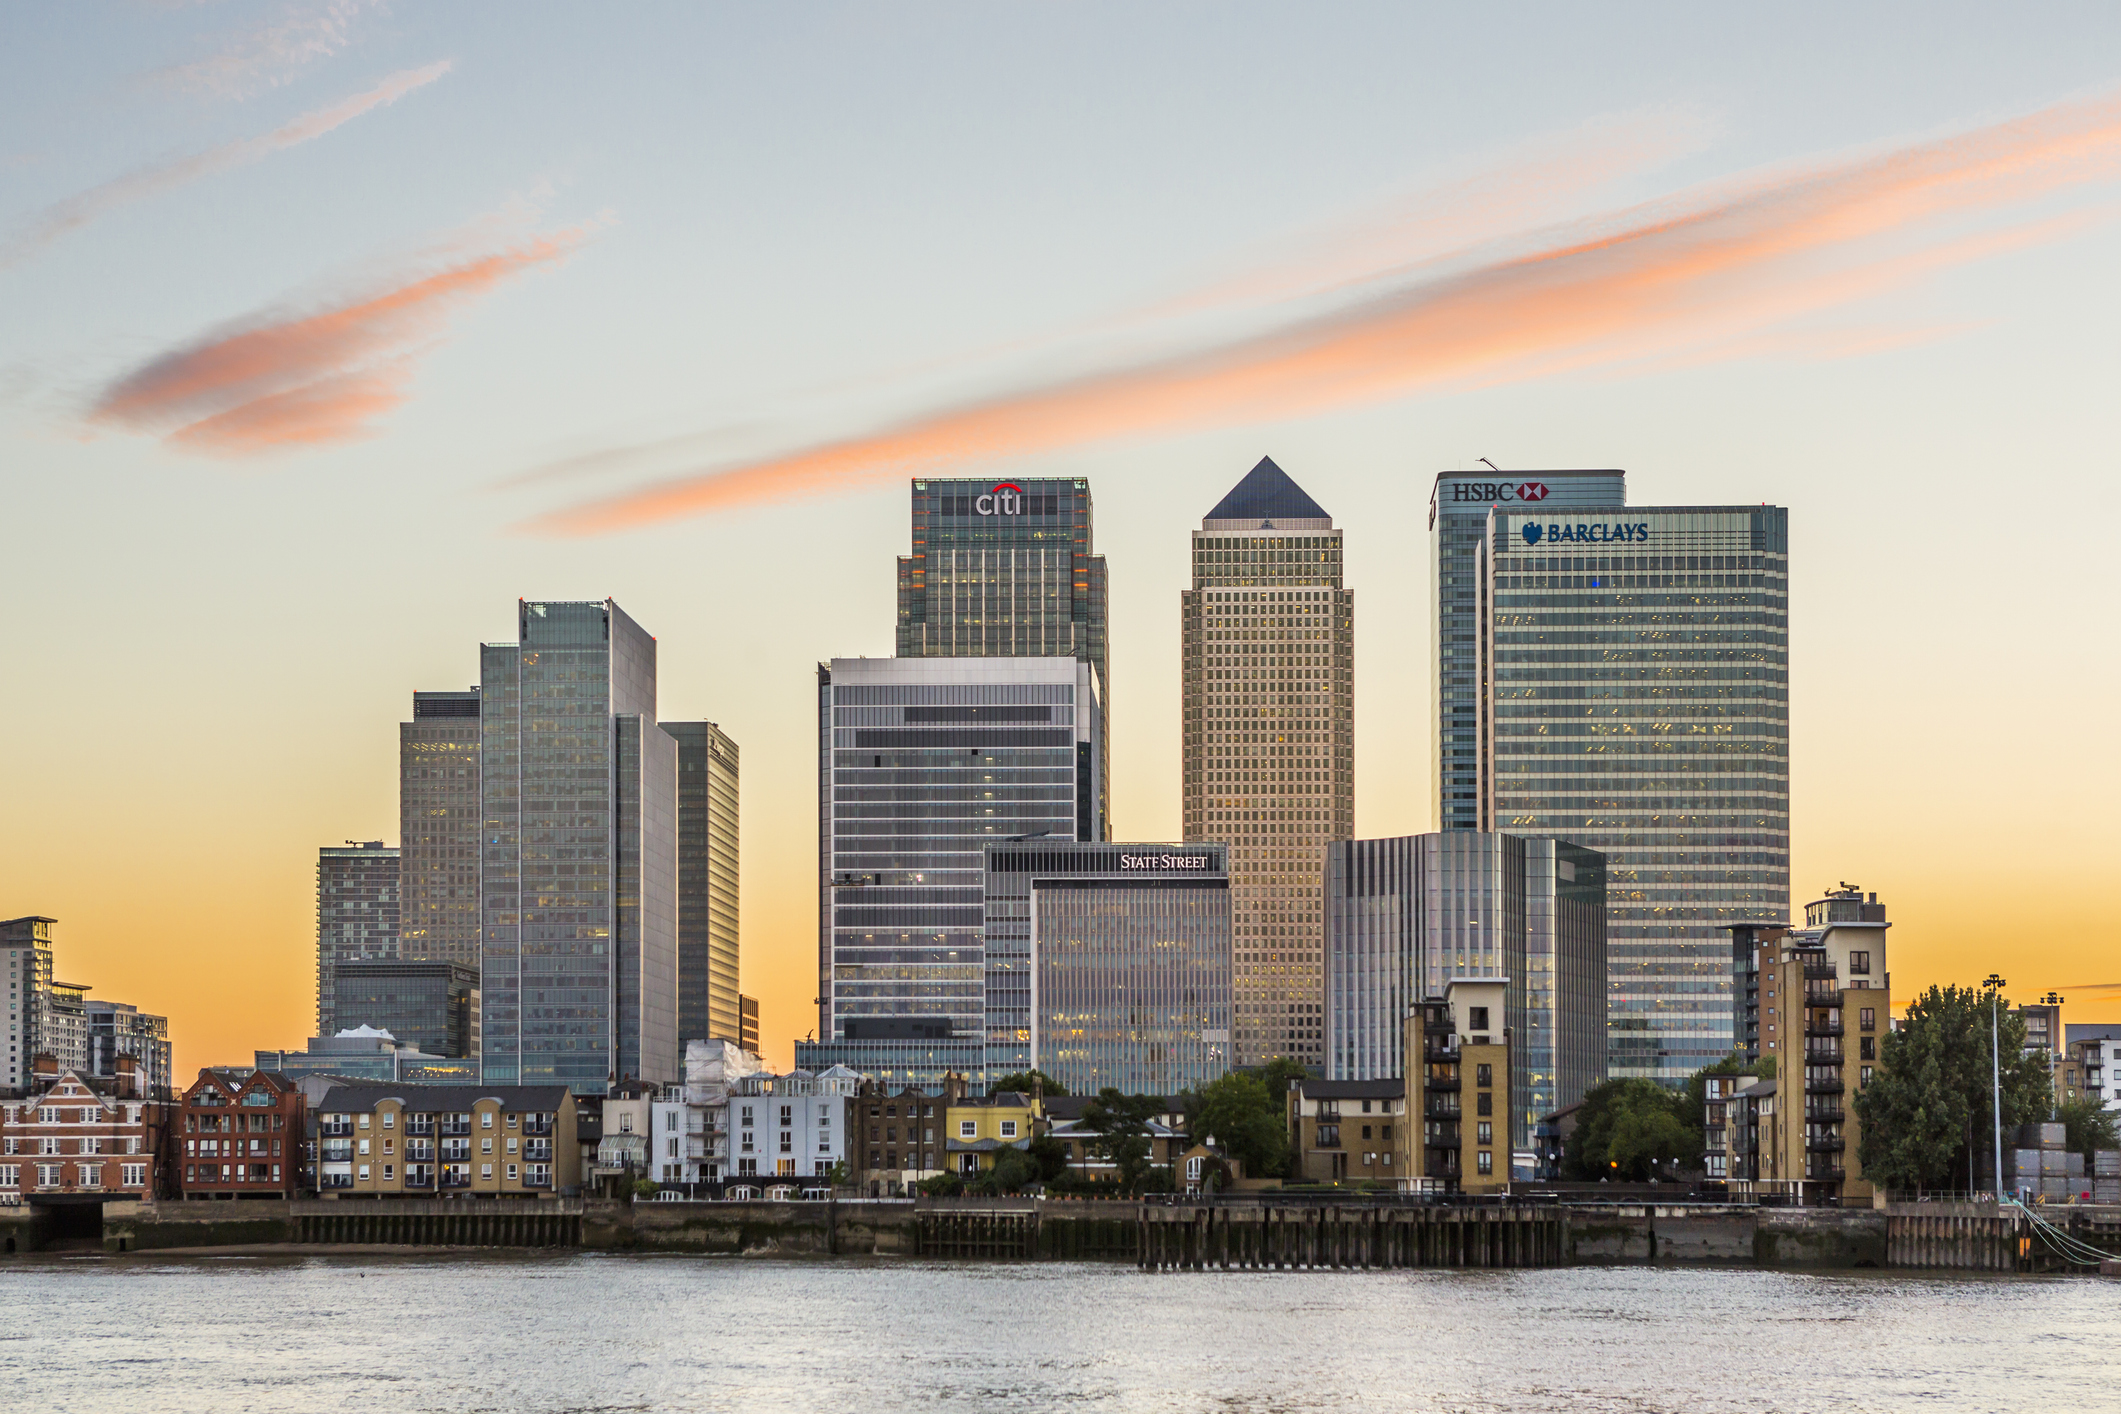
Tower Hamlets is the second-most popular London borough to move to in 2025. According to data from CompareMyMove, 4.55% of their London moves went to the area.
The borough is home to around 325,000 people and stretches from Tower Bridge to Canary Wharf and borders Hackney to its north.
Tower Hamlets encompasses much of the traditional East End of London but also includes areas like Canary Wharf, a major financial centre.
The average price of a home in this borough is £491,000, significantly below the London average, while a month of rent will cost £2,370 on average, according to the ONS.
Brent
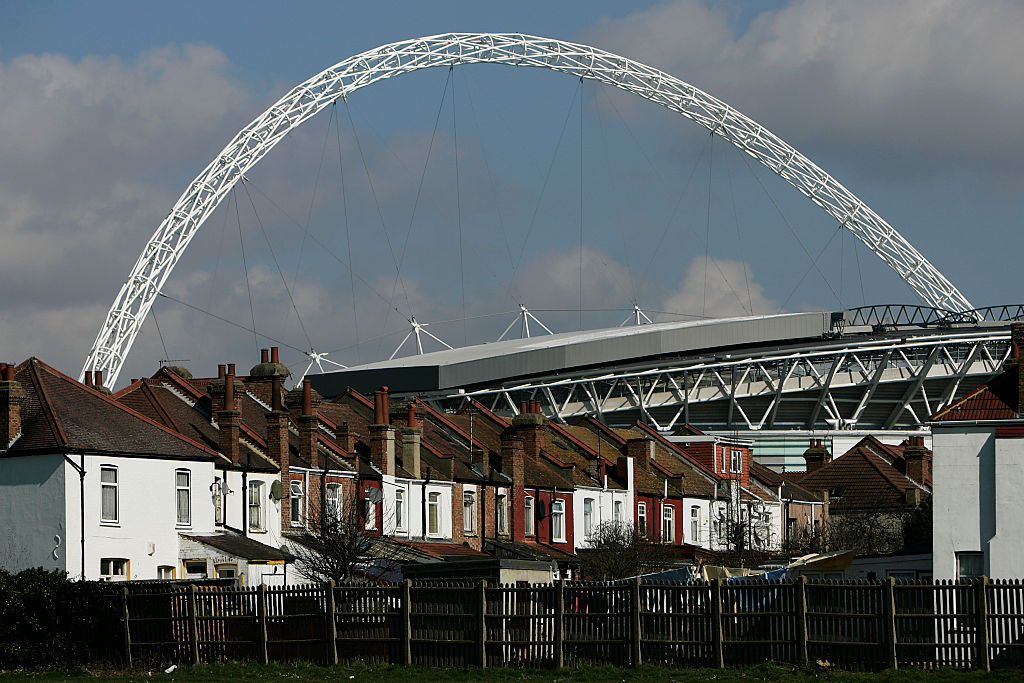
The third-most in demand borough of London to move to is Brent, where 4.55% of CompareMyMove’s users who moved to or within London chose as their home.
The borough is technically part of West London according to the London Plan, but includes within it areas generally considered to be part of north-west London, including Wembley and Willesden.
The most famous landmark in Brent is Wembley Stadium, the home of English football, but others include Neasden Temple, a Hindu temple that was once the largest outside of India.
The average house in Brent costs £536,000, just below the London average, while a month of rent costs around £1,948, according to ONS figures.
Southwark
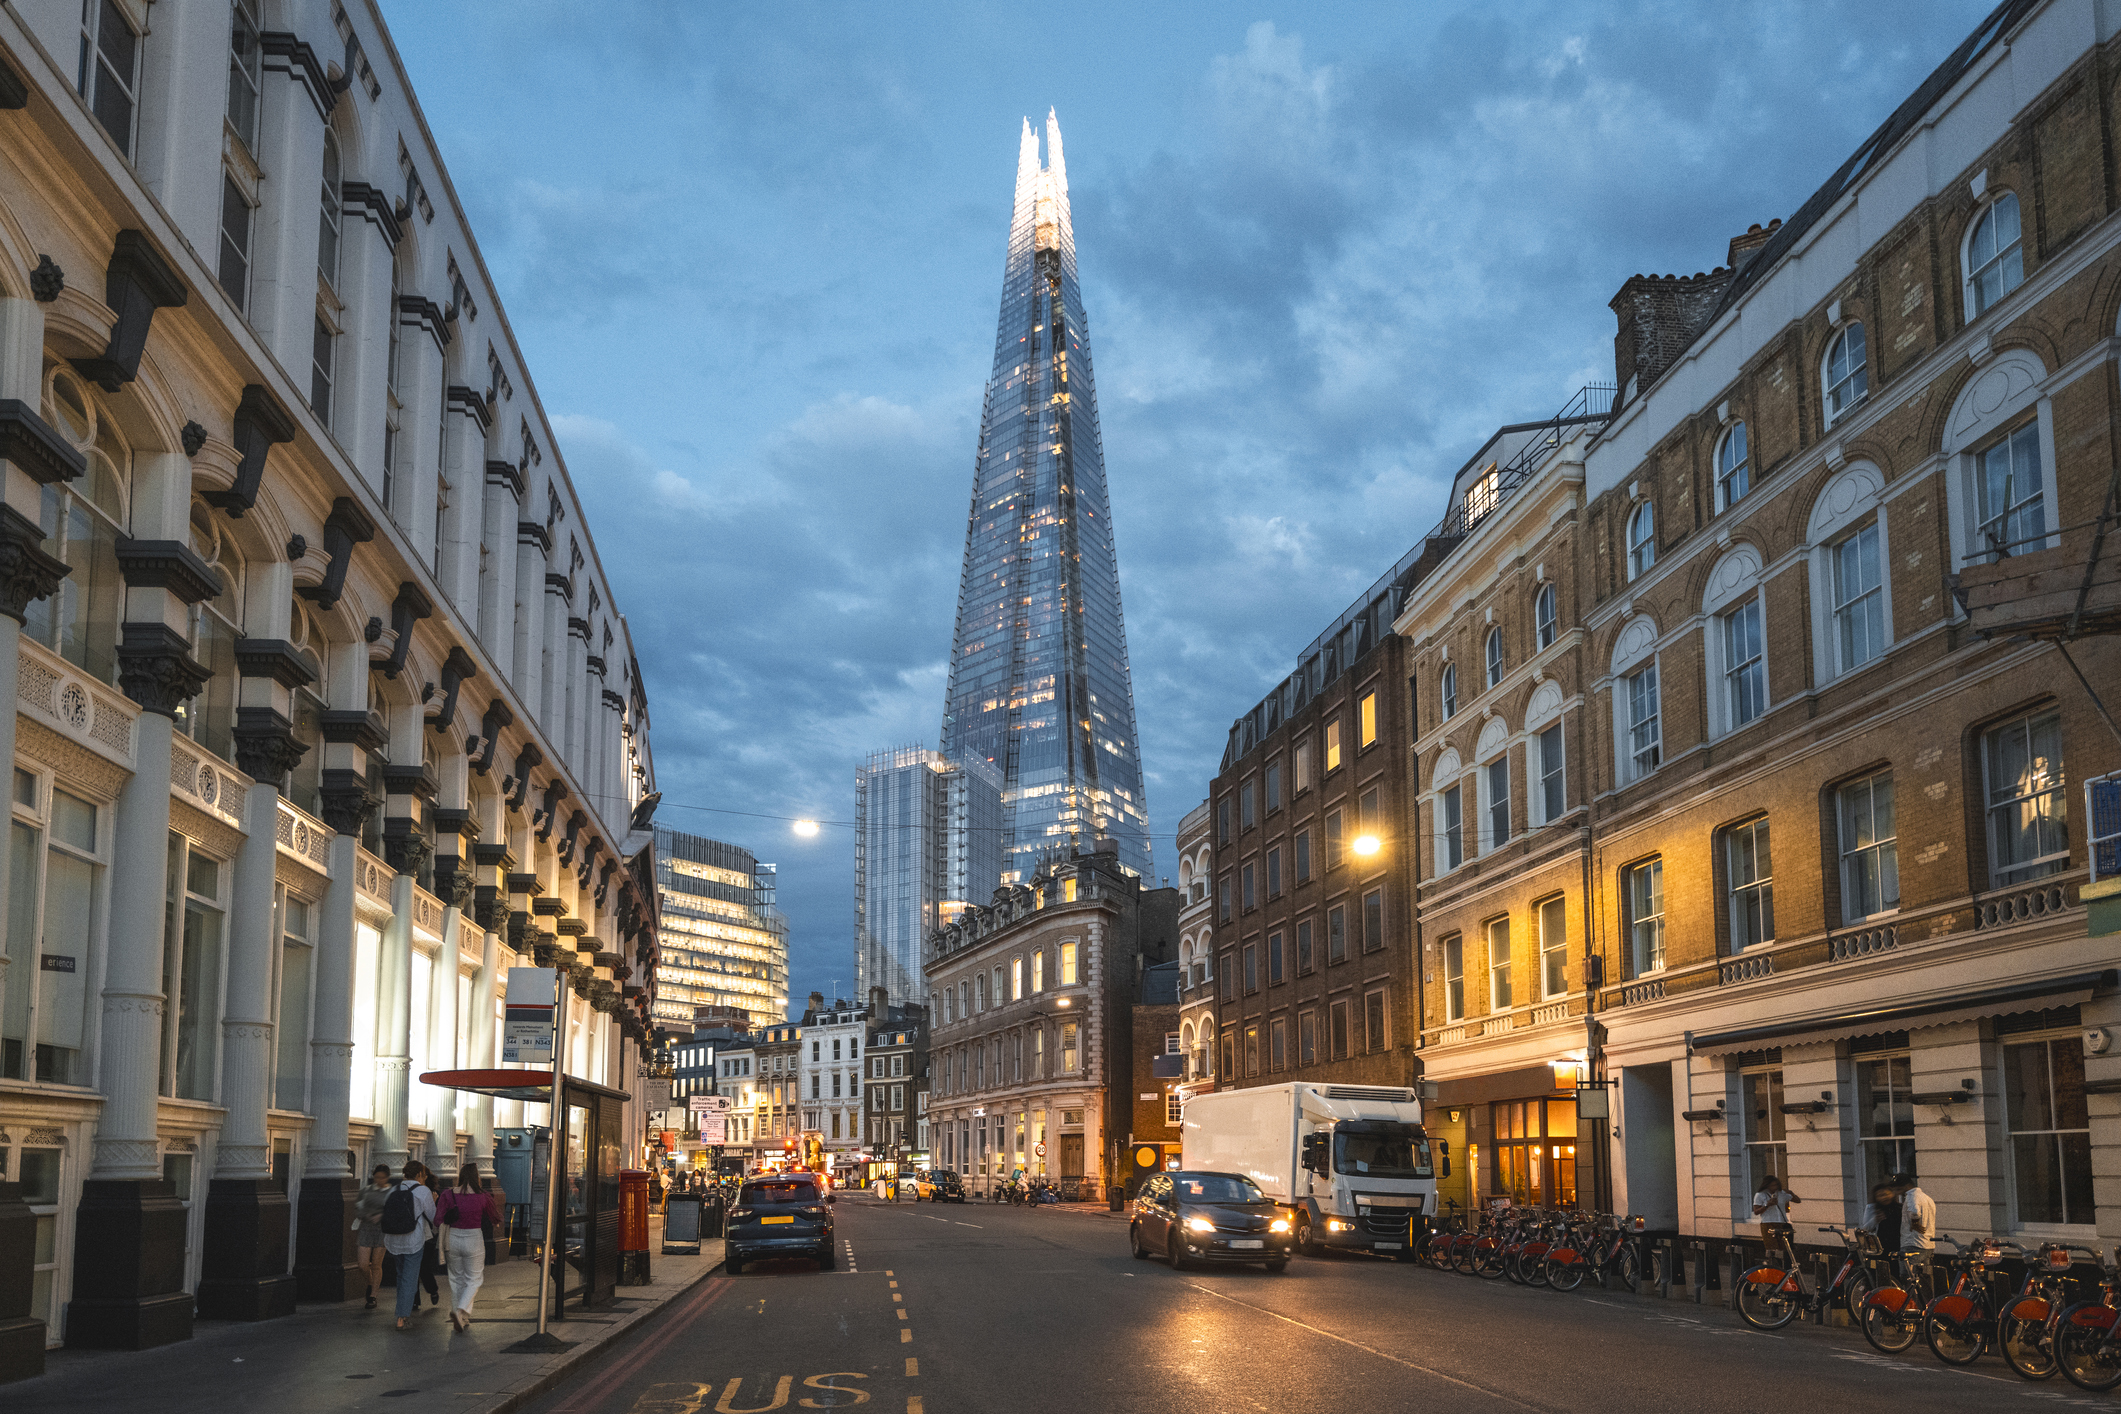
The borough of Southwark is popular among CompareMyMove’s users, with 4.06% of those moving to or within London going there so far in 2025.
Southwark is made up of a large chunk of the south bank of central London, including the Tate Modern art gallery, London Bridge, and Borough, but also stretches as far south as Crystal Palace.
The average house in the borough costs £582,000, more than the London average, and a month of rent typically costs £2,347, according to the ONS.
Croydon
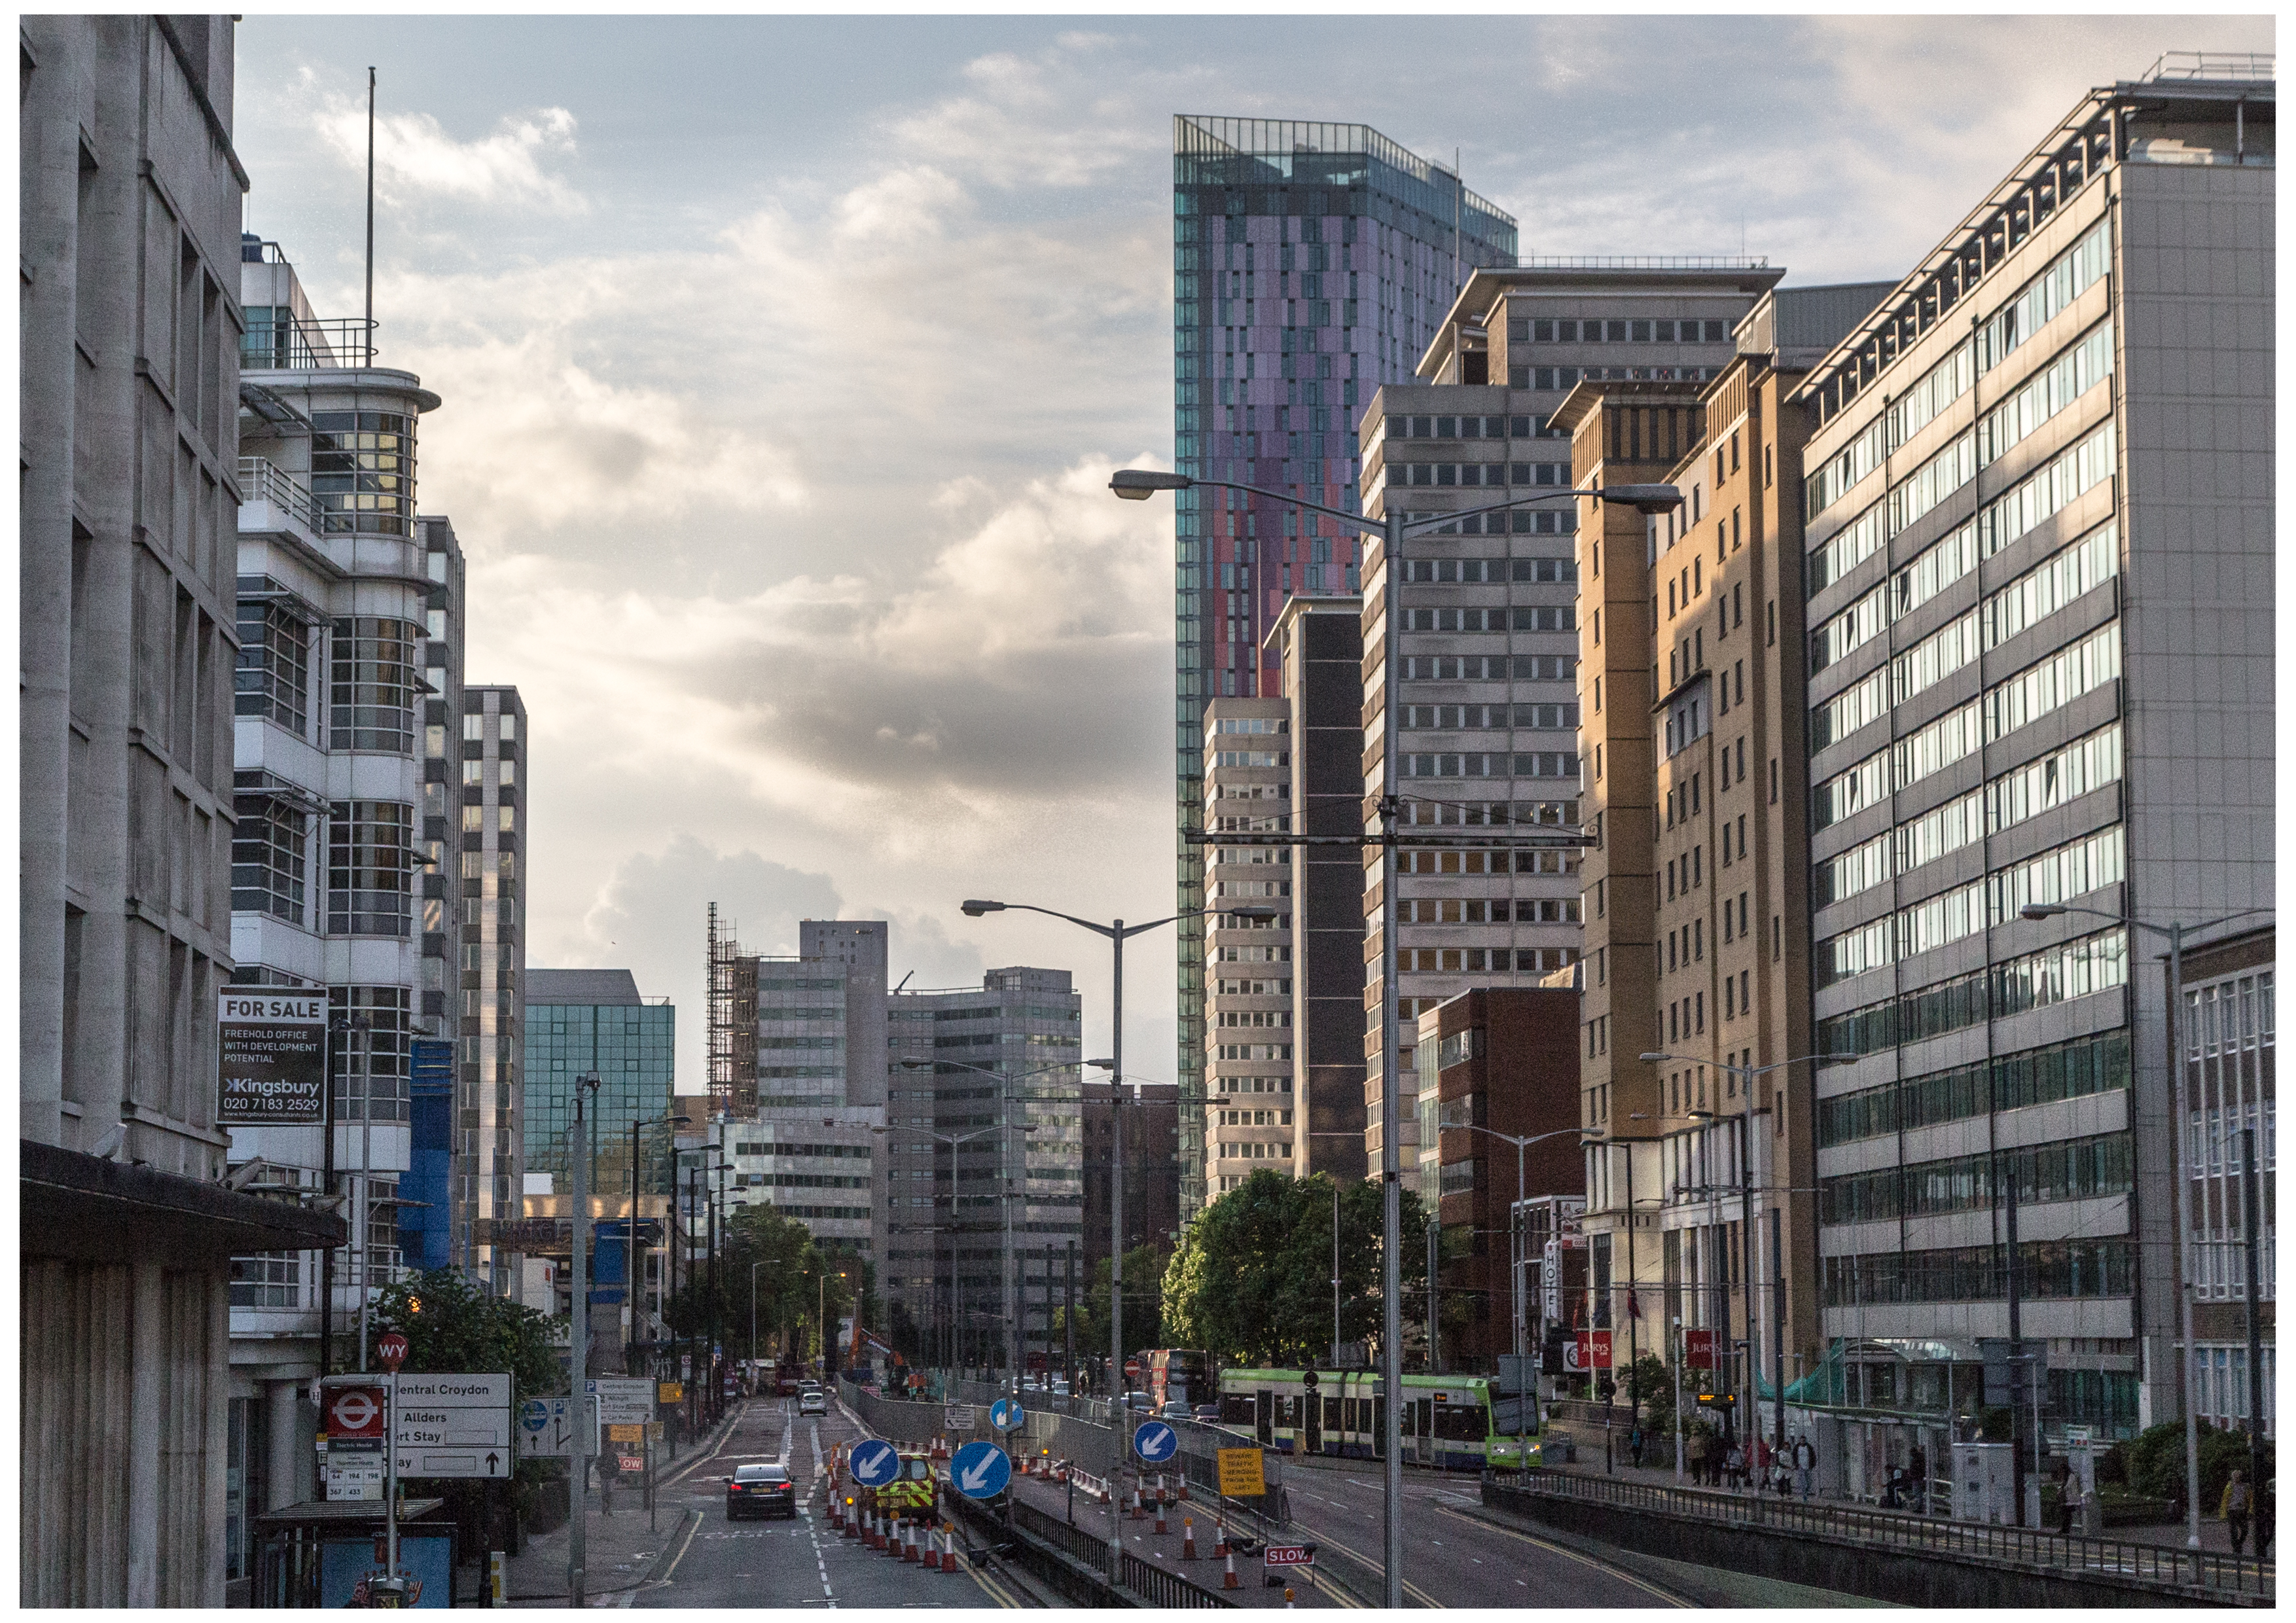
Rounding off the top five most in-demand London boroughs is Croydon, where 3.83% of CompareMyMove’s customers who moved to or within London chose as their new home.
Croydon is an outer borough of south London, and borders Surrey, but its north-most part borders Streatham common.
The borough is home to Selhurst Park, the home stadium of Crystal Palace Football Club, the Croydon Clocktower museum, and the BRIT school, a creative arts school that has produced a deluge of British performing artists, including Adele, Amy Winehouse, Tom Holland, and many more.
The average house in Croydon costs £400,000, well below the city’s average, and one month of rent costs an average of £1,534, according to the ONS.
London’s most in-demand boroughs: the full list
Rank | London Borough | Greater London Area | Percentage of Movers | Average Monthly Rent | Average House Price |
|---|---|---|---|---|---|
1 | Wandsworth | South | 4.76% | £2,526 | £691,000 |
2 | Tower Hamlets | East | 4.55% | £2,370 | £491,000 |
3 | Brent | West | 4.17% | £1,948 | £536,000 |
4 | Southwark | South | 4.06% | £2,347 | £582,000 |
5 | Croydon | South | 3.83% | £1,534 | £400,000 |
6 | Lambeth | South | 3.68% | £2,435 | £555,000 |
7 | Lewisham | South | 3.44% | £1,793 | £490,000 |
8 | Barnet | North | 3.36% | £1,886 | £598,000 |
9 | Greenwich | South | 3.34% | £1,880 | £462,000 |
10 | Bromley | South | 3.24% | £1,640 | £539,000 |
11 | Haringey | North | 3.20% | £2,189 | £622,000 |
12 | Ealing | West | 2.99% | £2,047 | £580,000 |
13 | Newham | East | 2.95% | £1,874 | £420,000 |
14 | Waltham Forest | East | 2.92% | £1,738 | £513,000 |
15 | City of Westminster | Central | 2.51% | £3,215 | £977,000 |
16 | Hammersmith and Fulham | West | 2.46% | £2,735 | £782,000 |
17 | Islington | Central | 2.44% | £2,701 | £684,000 |
18 | Richmond upon Thames | West | 2.39% | £2,235 | £801,000 |
19 | Kingston upon Thames | South | 2.26% | £1,833 | £589,000 |
20 | Hounslow | West | 2.25% | £1,891 | £536,000 |
21 | Merton | South | 2.22% | £2,061 | £633,000 |
22 | Bexley | East | 2.13% | £1,512 | £414,000 |
23 | Hillingdon | West | 2.10% | £1,531 | £479,000 |
24 | Harrow | West | 2.05% | £1,727 | £549,000 |
25 | Enfield | North | 2.00% | £1,738 | £474,000 |
26 | Camden | Central | 1.98% | £2,793 | £920,000 |
27 | Sutton | South | 1.87% | £1,524 | £446,000 |
28 | Hackney | East | 1.61% | £2,566 | £614,000 |
29 | Havering | East | 1.57% | £1,542 | £440,000 |
30 | Kensington and Chelsea | Central | 1.47% | £3,614 | £1,362,000 |
31 | Redbridge | East | 1.46% | £1,693 | £490,000 |
32 | Barking and Dagenham | East | 0.85% | £1,655 | £361,000 |
Source: CompareMyMove, September 2025, ONS
Get the latest financial news, insights and expert analysis from our award-winning MoneyWeek team, to help you understand what really matters when it comes to your finances.

Daniel is a financial journalist at MoneyWeek, writing about personal finance, economics, property, politics, and investing.
He covers savings, political news and enjoys translating economic data into simple English, and explaining what it means for your wallet.
Daniel joined MoneyWeek in January 2025. He previously worked at The Economist in their Audience team and read history at Emmanuel College, Cambridge, specialising in the history of political thought.
In his free time, he likes reading, walking around Hampstead Heath, and cooking overambitious meals.
-
 Average UK house price reaches £300,000 for first time, Halifax says
While the average house price has topped £300k, regional disparities still remain, Halifax finds.
-
 Barings Emerging Europe trust bounces back from Russia woes
Barings Emerging Europe trust has added the Middle East and Africa to its mandate, delivering a strong recovery, says Max King