Get the latest financial news, insights and expert analysis from our award-winning MoneyWeek team, to help you understand what really matters when it comes to your finances.
You are now subscribed
Your newsletter sign-up was successful
Want to add more newsletters?

Twice daily
MoneyWeek
Get the latest financial news, insights and expert analysis from our award-winning MoneyWeek team, to help you understand what really matters when it comes to your finances.

Four times a week
Look After My Bills
Sign up to our free money-saving newsletter, filled with the latest news and expert advice to help you find the best tips and deals for managing your bills. Start saving today!
An investment manager recently said to one of our team that charts were for sailors. We refute his distain; we say that there are two important skills, fundamental analysis and technical analysis (charts). One without the other is like Pinky without Perky!
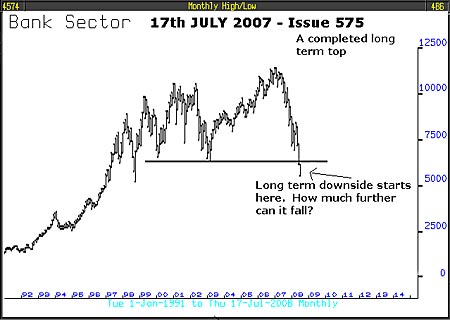
Almost a year ago, in issue number 575 dated 17th July 2008, in the conclusion, we said about the banking system: "The recent crisis at Fannie Mae and Freddie Mac is part of a very bad ongoing scene for banks look at the monthly chart from 1991 [it is republished below] and what you see last month a long-term top completed and July's decline below the lows of 2000 and 2003 just marks the end of the top formation and only this month the beginning of the long term down side yes, only the beginning."

We are pleased to say that we were spectacularly correct. The price level for the banking sector in July 2008 was 5,971, by March this year it had fallen to 2,268 a 66.66% fall, if we are right about what's going on, it could fall even lower. The forecast that we made in July 2008 was possible because of a combination of fundamental and technical analysis. Technical analysis is not about shapes and patterns but about the nature of price action and other technical indicators and the study of the price action of one investment class relative to another.
MoneyWeek
Subscribe to MoneyWeek today and get your first six magazine issues absolutely FREE

Sign up to Money Morning
Don't miss the latest investment and personal finances news, market analysis, plus money-saving tips with our free twice-daily newsletter
Don't miss the latest investment and personal finances news, market analysis, plus money-saving tips with our free twice-daily newsletter
The Bank of England pointed out in their recent Financial Stability Report that the banking system is still vulnerable to shocks. It highlighted the ongoing funding gap there is a shortfall between what banks have in deposits and what they lend out to customers. It has widened this past year to more than £800 billion. That's why banks aren't lending and instead are hoarding, a process that will not end any time soon.
Using technical and fundamental analysis, we were able, in July 2007, to call the commercial property problems and unequivocally advise readers to sell property fund investments - long term readers of the newsletter might remember.
Currently, the consensus is optimistic about the outlook for commercial property; however, the truth of the matter is that this sector is in distress. Rents are collapsing, vacancies are increasing and the property companies are over-borrowed. It was common practice in 2007 for covenant-lite loans of 85% of generous valuations to be made by banks with a less than thorough financial investigation into borrowers' capabilities. Today, all those deals are deeply underwater. The outlook remains bleak unless the "green shoots" quickly turn into tall trees. If they wither, watch out!
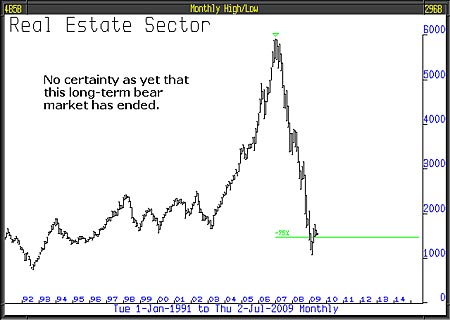
The stock market real estate sector, from its high in January 2007 to its March 2009 low, collapsed more than 75%; since, it has rallied but only modestly. The long-term monthly chart below is quite simple at its 2009 low, it had fallen over 75%, by a series of declines and rallies and it may be that the latest rally is just part of the continuing bear market. To judge that observation we need to see more detail.

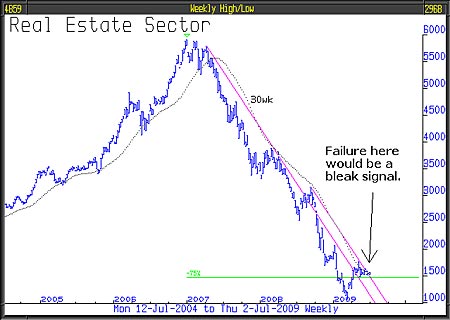
For more detail we turn to the five-year weekly chart, it tells us that the downside is still in place; however, that would change quite quickly on any kind of strength from here, fear and concern would rise rapidly on any weakness. To judge that, we need to see more detail.

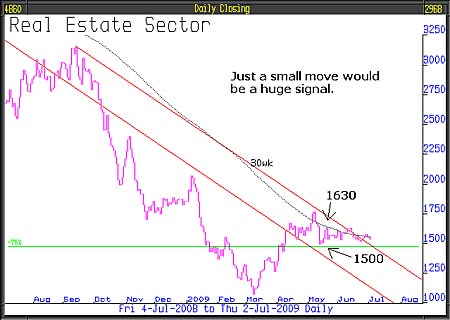
For more detail we turn to the one-year daily chart and focus on the most recent action, which from the beginning of April has been a very narrow trading range. That range would end to the upside or the downside following a relatively small move, but that small move could actually be a very big signal.
A break below 1,500 would confirm that the outlook for this stock market sector, and implicitly for commercial property, is awful. A break above 1630 would give support to the "green shoots" theory and add weight to a decision to abandon or lessen exposure to the RBS Bear Note and widen exposure to emerging markets and commodities.

At fullCircle we do this work for two very good reasons. The primary reason is to ensure we give valuable investment management service to our clients and to do that we need our own insights which cannot be obtained from anywhere else, only from our own work. The second reason is because it's such fun. We spend our lives, in effect, reading the most wonderfully page-turning mystery book ever conceived. It never ends and the plot's twists and turns keep us on the edge of our seats. As we put the book down every night we can't wait for the morning to pick it up again to find out what happens next!
This article was written by Full Circle Asset Management ,as published in the threesixty Newsletter on 3 July 2009.
Get the latest financial news, insights and expert analysis from our award-winning MoneyWeek team, to help you understand what really matters when it comes to your finances.
MoneyWeek is written by a team of experienced and award-winning journalists, plus expert columnists. As well as daily digital news and features, MoneyWeek also publishes a weekly magazine, covering investing and personal finance. From share tips, pensions, gold to practical investment tips - we provide a round-up to help you make money and keep it.
-
 MoneyWeek Talks: The funds to choose in 2026
Podcast Fidelity's Tom Stevenson reveals his top three funds for 2026 for your ISA or self-invested personal pension
-
 Three companies with deep economic moats to buy now
Opinion An economic moat can underpin a company's future returns. Here, Imran Sattar, portfolio manager at Edinburgh Investment Trust, selects three stocks to buy now

