Are we heading for another October crash, or should you stay long?
Stockmarket crashes always seem to happen in October. And markets are currently in a downtrend. Dominic Frisby asks if we’re heading for something more serious.

Get the latest financial news, insights and expert analysis from our award-winning MoneyWeek team, to help you understand what really matters when it comes to your finances.
You are now subscribed
Your newsletter sign-up was successful
Want to add more newsletters?

Twice daily
MoneyWeek
Get the latest financial news, insights and expert analysis from our award-winning MoneyWeek team, to help you understand what really matters when it comes to your finances.

Four times a week
Look After My Bills
Sign up to our free money-saving newsletter, filled with the latest news and expert advice to help you find the best tips and deals for managing your bills. Start saving today!

I've been reading a number of bearish prognostications in recent weeks about US stockmarkets, and by extension, stockmarkets around the world.
Recent actions taken by the Federal Reserve America's central bank whether rate cut or liquidity injection, have had little effect and the market is heading for a meltdown.
That's the main line of argument.
MoneyWeek
Subscribe to MoneyWeek today and get your first six magazine issues absolutely FREE

Sign up to Money Morning
Don't miss the latest investment and personal finances news, market analysis, plus money-saving tips with our free twice-daily newsletter
Don't miss the latest investment and personal finances news, market analysis, plus money-saving tips with our free twice-daily newsletter
Is the end of the world nigh?
Sometimes stockmarkets don't crash in October
It's October. That's the stock market crash's month of choice.
Crashes always seem to happen in October. Think of the Great Crash of 1929. That's the famous one. Or Black Monday in 1987. Not quite so famous, but epic nonetheless. It just looks like a blip now, but markets lost almost a quarter of their value on one horror day.
Then there was the most recent 2008. The Great Financial Crisis.
They all happened in October.
But...
I don't know how many Octobers there have been in stockmarket history. But there have at least a hundred in the last hundred years, and over 95% of them haven't seen stock market crashes.
So nothing too much to worry about there, I'd say.
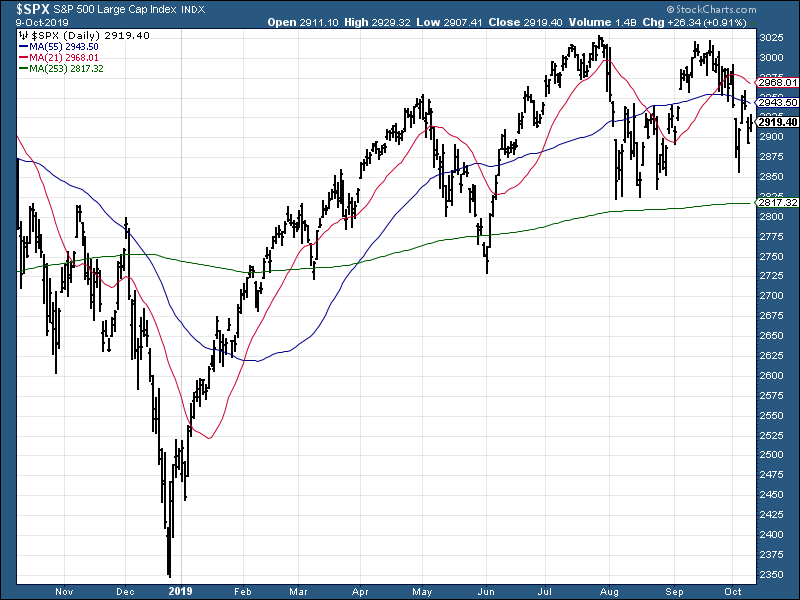
That said, we are now in a downtrend, at least on a short-term basis. Having hit new highs in July at 3,027, the S&P 500 re-tested them rather meekly in September; failed; and it has been in a downtrend ever since.
My simple measure of that downtrend is to use moving averages which show the average price over a recent period. I'm going to look at the 21-day (blue line) and 55-day (red line) moving averages here. Both are now sloping down, and the S&P's price is below them.
In other words, we are in a downtrend on a 21- and 55-day basis.
However, the 253-day moving average (green) is sloping up. (I use the 253-day moving average because there are 253 trading days in a year it might seem like rather arbitrary number but there is good reason for it).

In other words, on a longer-term, one-year basis the trend is still up.
The big question is, does this short-term trend have the potential to grow into something bigger?
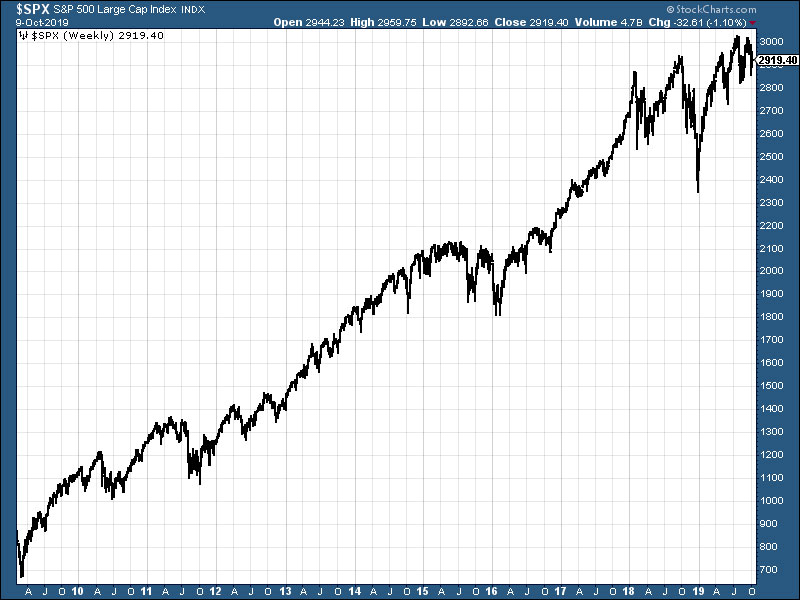
Well, all long-term trends start out as short-term trends. And given the extraordinary bull market we have seen in US stocks, which, depending on your measures began in 2009 with the S&P 500 at 666, or in 2016 at 1,800, you could certainly make the case that we are "due" a pullback.
This has been an incredible run for the US market so will it continue?
Here's the last ten years of the S&P 500. What a run!

It's easy to look at that chart and think: "Wow! This thing is going to crash hard".
But how many pull backs have there been along the way? Pull backs just like this one. Imagine if you panicked and sold each and every one. If you are a short-term trend follower, you might have done just fine. But long-term buy and hold is the best way to play a bull market.
The problem is long-term buy-and-hold is a disaster in a bear or flat market. So what method do you use to identify what kind of market you are in?
Each to his own. Some rely on fundamental analysis of some kind. Others are event-driven. Others rely on the myriad of different technical indicators there are.
Me? I like moving averages. I must have looked at or written about a hundred different systems over the years, but the most effective I have found is simple trend-following using moving averages.
I stress that it is the most effective method for me. You will have your own methods that better suit your intellect, psychology, circumstances and emotions.
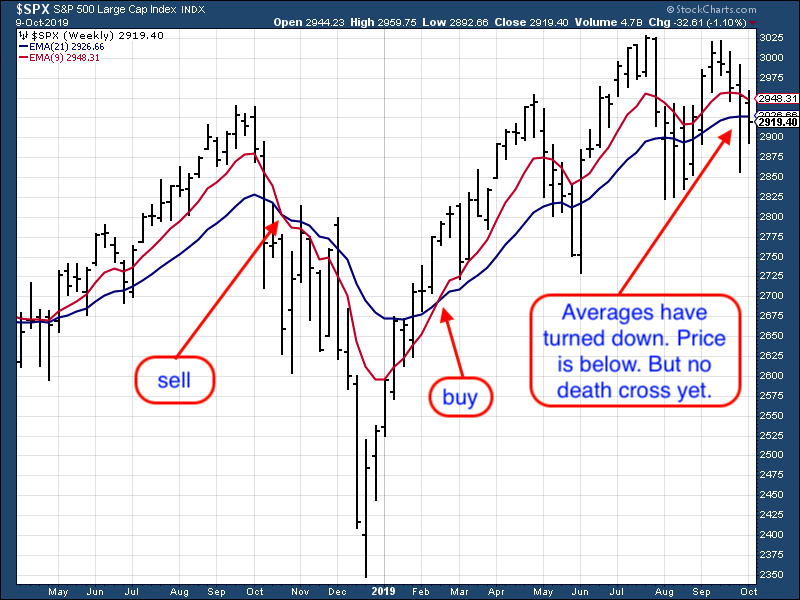
I outline my method here. I take the 21- and nine-week moving averages. When they are sloping up and the price is above, I am long. When they are sloping down and the price is below, I am short.
And what is the system telling us at the moment?
The message is not great. The "buy" signal came back in February. But now the moving averages have turned down. We don't want to be buying here. But the system hasn't yet issued a "sell" signal. (The signals come when the averages cross up or down the former being your "golden cross" buy, the latter your "death cross" sell.)

Sometimes there is a time to take action. Sometimes there is a time to do nothing.
The signal is currently saying do nothing. It's hard when it's like this. The market is obviously trending down. You want to sell. But you haven't actually got a sell signal. If the market turns back up and you had sold, you would have not only broken the rules, you would feel like a fool.
So, to answer my initial question: the current stockmarket action is not encouraging. It looks like we are headed lower. But there have been a gazillion such false bears in the path and this could be yet another one of them.
We obey the rules of the system. And, for now, we stay long.
Get the latest financial news, insights and expert analysis from our award-winning MoneyWeek team, to help you understand what really matters when it comes to your finances.

-
 Barings Emerging Europe trust bounces back from Russia woes
Barings Emerging Europe trust has added the Middle East and Africa to its mandate, delivering a strong recovery, says Max King
-
 How a dovish Federal Reserve could affect you
Trump’s pick for the US Federal Reserve is not so much of a yes-man as his rival, but interest rates will still come down quickly, says Cris Sholto Heaton