Get the latest financial news, insights and expert analysis from our award-winning MoneyWeek team, to help you understand what really matters when it comes to your finances.
You are now subscribed
Your newsletter sign-up was successful
Want to add more newsletters?

Twice daily
MoneyWeek
Get the latest financial news, insights and expert analysis from our award-winning MoneyWeek team, to help you understand what really matters when it comes to your finances.

Four times a week
Look After My Bills
Sign up to our free money-saving newsletter, filled with the latest news and expert advice to help you find the best tips and deals for managing your bills. Start saving today!
"They said shares were for the long term," says Richard Northedge in The Independent on Sunday. But "how long does long have to be"? The FTSE 100 is now around 13% below its level of mid-July 1998. Throw in dividends and the index is up by around 14%, says Jennifer Hill in The Sunday Times. That's a pretty paltry annual return of around 1.4%, but it highlights the importance of reinvesting dividends.
Stockmarket historian David Schwartz notes that looking at average annual returns from 1900, capital gains come in at around 1%; with reinvested dividends, the figure rises to 4%-5%. Still, factor in inflation over the past decade and the return is negative; as Northedge notes, shares need to have risen by 20% to keep pace with price increases.
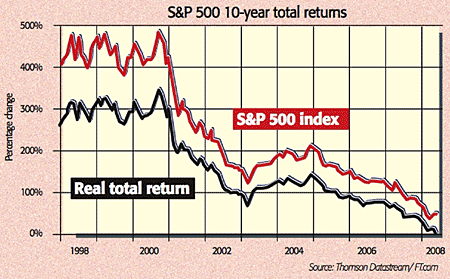
It's a similar story in the US, where Richard Bernstein of Merrill Lynch has pointed out that the real total return on the S&P 500 was marginally negative in the decade to the end of June despite having hit 300% in the late 1990s thanks to the market boom in the previous ten years and two hefty bull runs in the past decade. The last lost decade was 1973-83.
MoneyWeek
Subscribe to MoneyWeek today and get your first six magazine issues absolutely FREE

Sign up to Money Morning
Don't miss the latest investment and personal finances news, market analysis, plus money-saving tips with our free twice-daily newsletter
Don't miss the latest investment and personal finances news, market analysis, plus money-saving tips with our free twice-daily newsletter
History shows that long dry spells are far from uncommon. The longest period of negative real returns in the US was 16 years, between 1915 and 1920, according to the Global Investment Returns Yearbook 2008. Britain's worst stretch was between 1900 and 1921 (-4%); France, Germany and Japan had negative returns for the first half of the 20th century.

And there are likely to be more lean years ahead. History shows that stocks move in up and down cycles lasting around 15 years, with valuations moving from historically high levels to very low ones. In both the US and the UK stocks have yet to hit the single-digit p/es and above-average dividend yields 5%-6% associated with long-term bottoms.
The S&P's dividend yield, for instance, is still a lowly 2.4%, compared with the historical average of 4.3%. The fact that we still face much of the "excruciating unwind of the credit bubble" and "earnings bonanza" of the past few years, as Mark Gongloff puts it on The Wall Street Journal, also suggests that the post-2000 bear market is unlikely to have concluded just yet.
No sighting yet of a classic buy signal
One signal of long-term value in UK stocks, as Buttonwood points out in The Economist, is when the historic yield on the FTSE All-Share index exceeds the yield on ten-year government bonds. That last happened as the market bottomed in March 2003. When this occurs, investors "get paid more to hold equities (with all their growth prospects) than stodgy government bonds". There's no such buy sign today, though: the yield on stocks is around 4.3% but the ten-year gilt's is 5.06%.
At present, rather than head for the safety of the bond market as they did in March 2003, investors are "shunning" fixed-income securities because they are worried about inflation, as Neil Hume notes in the FT. It seems the market still has some way to fall if the March 2003 buy signal is to be repeated.
and a sell sign flashes its legs
The hemline indicator is coming up trumps again. Economic and market turmoils tend to go with falling hemlines people feel less confident and dress less showily while short skirts are a sign of exuberance. In the 1920s, hemlines on dresses "shot up" to reveal women's legs for the first time, notes Roya Nikkhah in The Daily Telegraph, while dresses dropped to the floor by the time of the 1929 crash. Fashion has had its finger on the market pulse again this time: in this summer's collections, displayed last October when markets were still buoyant, "legs were nowhere to be seen".
Get the latest financial news, insights and expert analysis from our award-winning MoneyWeek team, to help you understand what really matters when it comes to your finances.
MoneyWeek is written by a team of experienced and award-winning journalists, plus expert columnists. As well as daily digital news and features, MoneyWeek also publishes a weekly magazine, covering investing and personal finance. From share tips, pensions, gold to practical investment tips - we provide a round-up to help you make money and keep it.
-
 The most single-friendly areas to buy a property
There can be a single premium when it comes to getting on the property ladder but Zoopla has identified parts of the UK that remain affordable if you aren’t coupled-up
-
 RICS: UK housing market showing signs of 'tentative recovery'
RICS members are becoming less negative about property sales and house prices. What does the latest data mean for the property market?

