The charts that matter: it’s all about the bitcoin
This week it was all about bitcoin, says John Stepek. The digital currency's explosive move higher really catapulted it into the limelight.

Get the latest financial news, insights and expert analysis from our award-winning MoneyWeek team, to help you understand what really matters when it comes to your finances.
You are now subscribed
Your newsletter sign-up was successful
Want to add more newsletters?

Twice daily
MoneyWeek
Get the latest financial news, insights and expert analysis from our award-winning MoneyWeek team, to help you understand what really matters when it comes to your finances.

Four times a week
Look After My Bills
Sign up to our free money-saving newsletter, filled with the latest news and expert advice to help you find the best tips and deals for managing your bills. Start saving today!
Welcome to your weekend edition, where we take a look through the charts that matter and catch up on anything else that we missed during the week.
This week it was all about bitcoin. The digital currency burst through the $10,000 a coin mark and beyond. Then it promptly fell back to around $9,000. But its explosive move higher really catapulted it into the limelight.
It appears that one of the key drivers was discussions over the dinner table at American Thanksgiving celebrations. A record number of Coinbase accounts were opened over the weekend, as presumably tech-savvy bitcoin fans helped less tech-savvy relatives to get in on the game.
MoneyWeek
Subscribe to MoneyWeek today and get your first six magazine issues absolutely FREE

Sign up to Money Morning
Don't miss the latest investment and personal finances news, market analysis, plus money-saving tips with our free twice-daily newsletter
Don't miss the latest investment and personal finances news, market analysis, plus money-saving tips with our free twice-daily newsletter
That would look like a bubble indicator in itself, but there are so many of them right now, that it's impossible to pick out the ones that suggest anything.
Pop star Katy Perry posted a picture of herself on social media apparently asking Warren Buffett about bitcoin. Someone else has harnessed their Tesla to mine bitcoin for free (by generating the electricity via Tesla's free chargers).
It's all very toppy, but this market is determined to go as far as it possibly can in terms of giving us a view of how surreal these things can get.
But what's also interesting is that the bitcoin-mania the fear of missing out seems to be infecting other markets. The S&P 500 rocketed higher, for example, before the usual jitters about tax plans and the rest gave it a bit of a reality check.
Meanwhile, the British pound made a bit of a breakthrough as it looked as though we might be nearing a Brexit deal that everyone can shake on. We'll see what happens there, but my colleague Dominic certainly thinks that the pound is now on its way up (and to be fair, he said that before the deal was announced).
I'm sure there'll be plenty more twists and turns on the Brexit front, but as far as I can see, it's now a debate that's mainly being played out by extremists on either side who are able to push their views via one national newspaper or another. They'll continue to complain at one another and point out each other's flaws but hopefully the rest of us can continue to just get on with things.
And now, turning to our regular charts
Now we'll turn to our charts, but first, if you missed any of this week's Money Mornings, here are the links to catch-up.
Monday: Is it time to buy Centrica for its huge dividend?
Tuesday: How central banks paved the way for bitcoin's birth
Wednesday: What to do if you've missed out on the bitcoin super-bubble
Thursday: Meet the new boss same as the old boss
Friday: Why did the crash of 1929 turn into the Great Depression?
For the next few weeks at least, I've added the Topix index, Japan's key stockmarket, to our list. (In Japan, the Nikkei is analogous to the Dow Jones; the Topix is the S&P 500). Here's why.
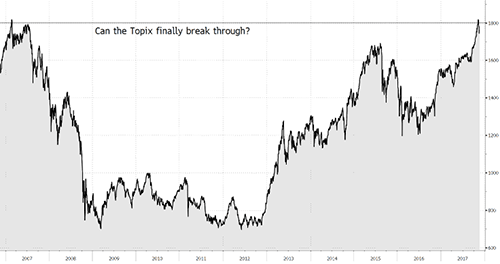
The Topix index hasn't managed to claw back above the 1,800 level since the collapse of the Japanese bubble at the beginning of the 1990s. Jonathan Allum at broker SMBC Nikko describes the level as "the iron coffin lid". As the chart below shows, the last time it was challenging this level, was in 2007.
However, this week, the Topix managed to poke its head back above 1,800 and at the time of writing, it's still hovering there. If the market can break above it convincingly, it would be a very bullish sign although given the current faintly hysterical tone of markets generally, it's possible that this could also mark a fresh top of some sort.
Which is why, of course, we're keeping an eye on it.
Gold had a bit of a grim week as everyone decided that they desperately want to own bull market assets. That said, the $1,270 per ounce mark still seems to be holding.
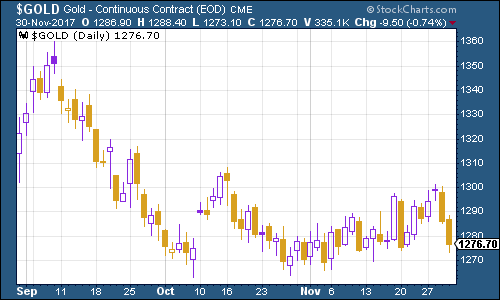
(Gold: three months)
What's perhaps a little more concerning for gold is that the US dollar index a measure of the strength of the dollar against a basket of the currencies of its major trading partners also edged lower over the course of the week. This was partly because the new Federal Reserve head, Jay Powell, appears to be on the dovish' side, which in turn, suggests we'll get the same old Fed policy we've always had.
This would normally prop up gold, but investors right now very much want to embrace risk, not shelter from it.
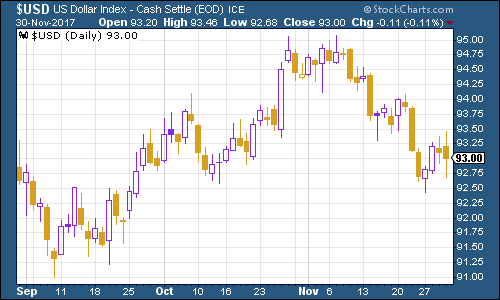
(DXY: three months)
Meanwhile, the yield on ten-year US Treasury bonds headed sharply higher this week as the market started to get excited about reflation again. We're now just above the 2.4% mark that's seen as a major line in the sand by many analysts.
Keep a close eye on this. If people start to believe in the reflation story, Treasuries could sell off a great deal further.
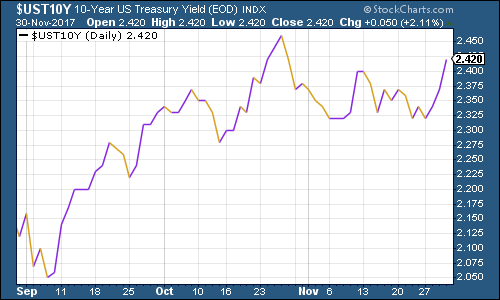
(Ten-year US Treasury: three months)
Copper had another tricky week given the wider enthusiasm for the markets it's interesting that this one can't maintain its bullish momentum. That said, the main issue for copper appears to be fairly specific there are concerns that China might step in to calm its booming housing market.
In effect, there are plenty of empty properties in China and the government is planning reforms to push their owners to rent them out, rather than using them purely as investment vehicles. That would mean less demand for new housing, thus less demand for base materials such as copper.
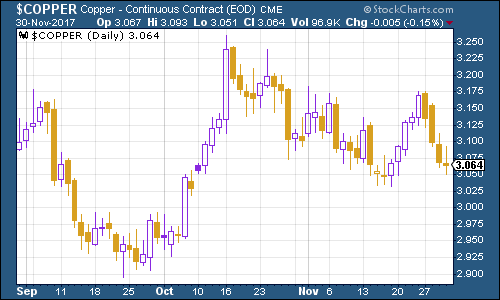
(Copper: three months)
Bitcoin what can I say? Last week I noted that one analyst had called for $10,000 a bitcoin, and this week we got it.
In the process it has become exceptionally volatile. I've used a candlestick' chart below, covering the past five days, as opposed to the usual line chart. This shows the swings in the intraday price as well as the closing price. You can see that in the last three days, bitcoin has spiked to nearly $11,500, and swung back as low as $9,000.
Of course, bitcoin has seen these sorts of corrections pretty much every time it spikes higher. Is this the final spike? No idea. Dominic and I both wrote about bitcoin this week you can check out our pieces here and here.
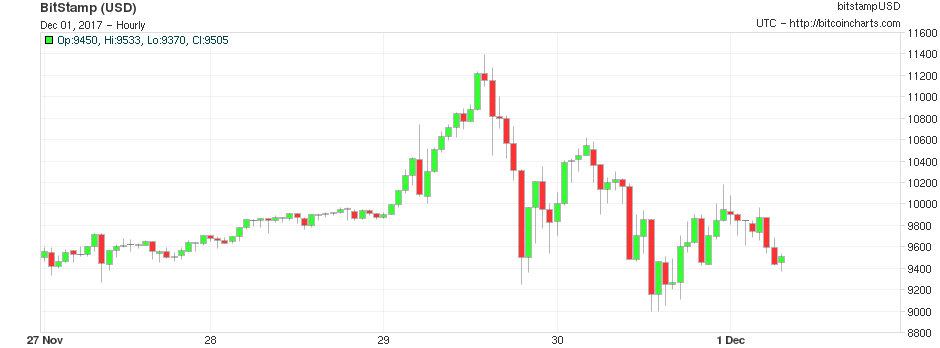
(Bitcoin: five days)
This week, the four-week moving average of weekly US jobless claims rose, to 242,250, while weekly claims fell to 238,000. According to David Rosenberg of Gluskin Sheff, when US jobless claims hit a "cyclical trough" (as measured by the four-week moving average), a stockmarket peak is not far behind (on average 14 weeks), a recession follows about a year later.
As the chart below shows, the most recent cyclical trough was just a couple of weeks ago, at 231,250. So we could still be a way from the peak.
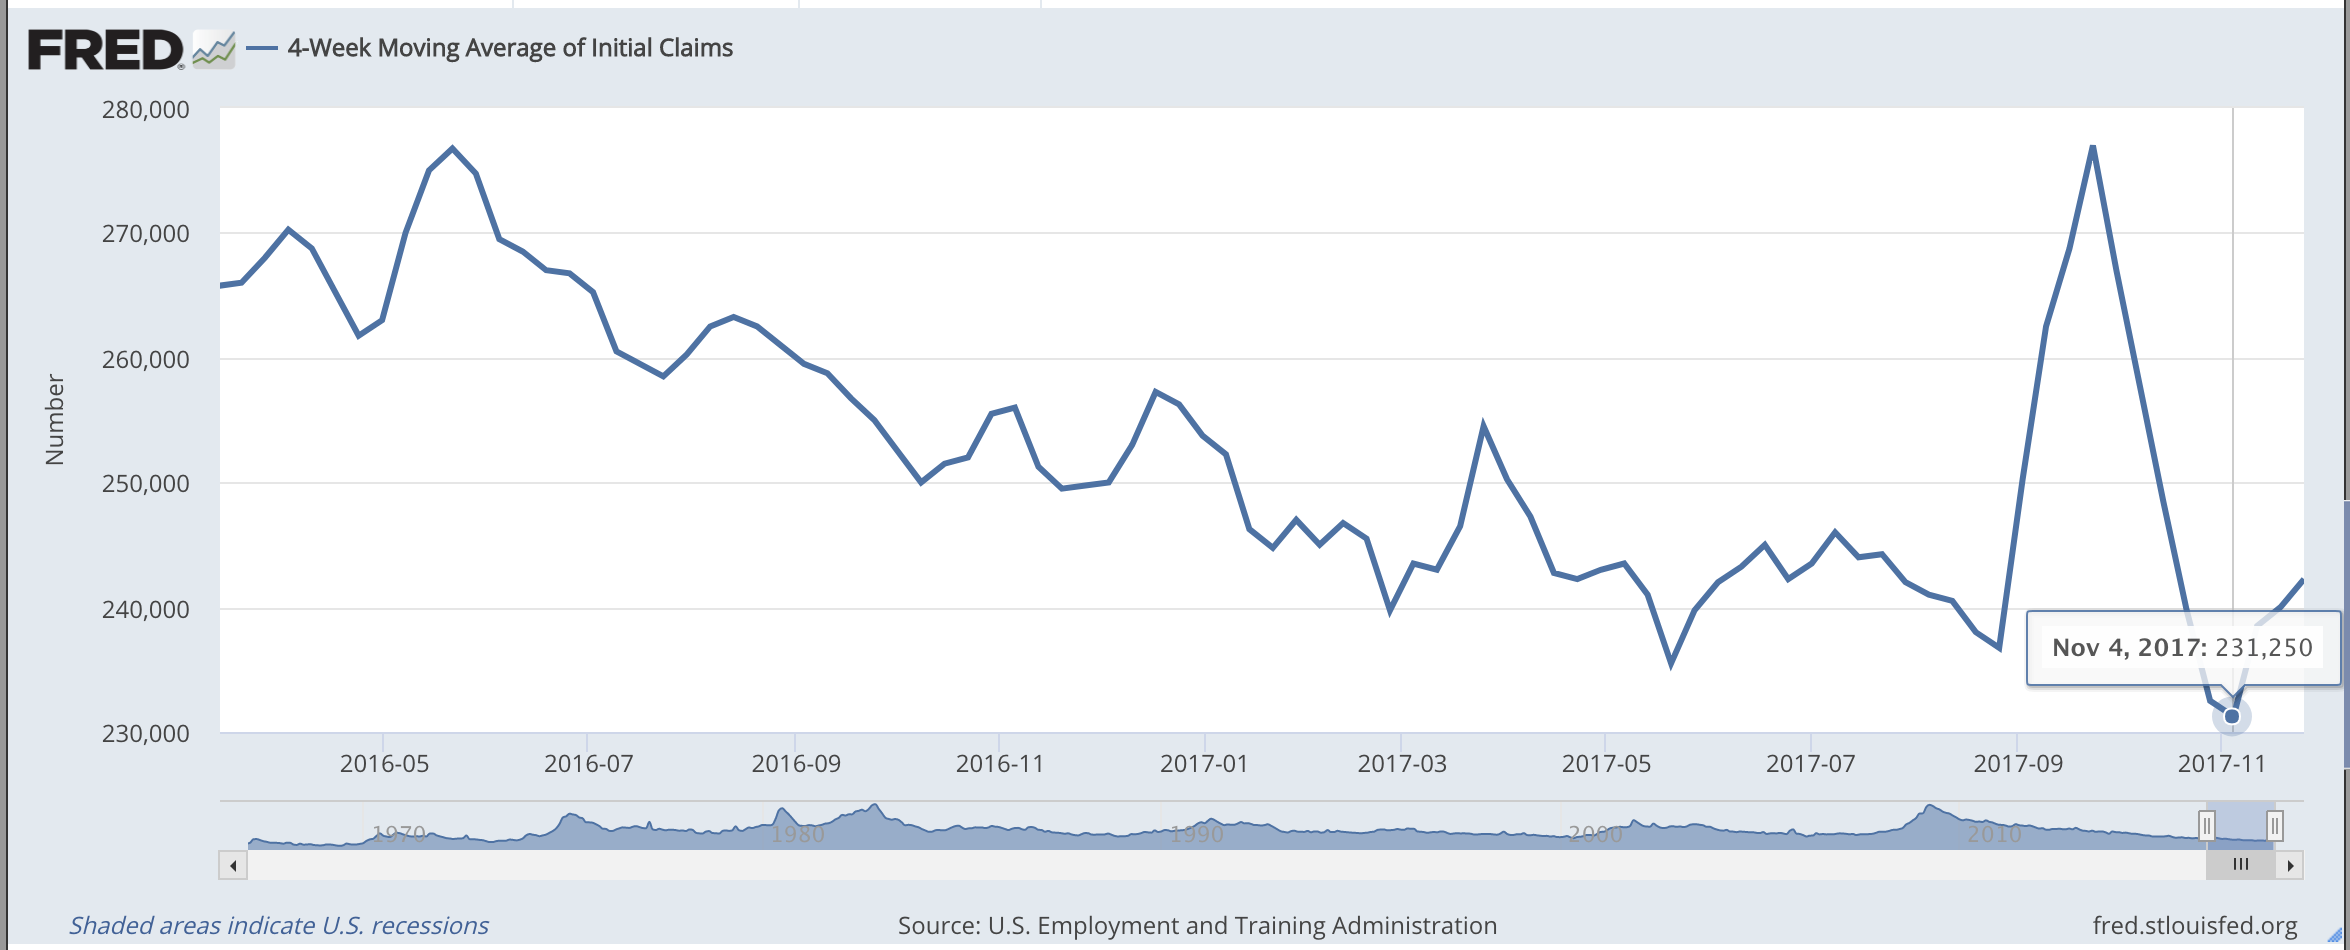
(Four-week moving average, US jobless claims, year-to-date)
The oil price (as measured by Brent crude, the international/European benchmark) hasn't changed much. Traders had been expecting oil cartel Opec to extend its production cuts when the oil producers met up on Thursday, and that's just what happened.
The question now is whether or not oil prices will be able to rise much further given the likely reaction of shale producers. Then again, it wouldn't be the first time that markets have underestimated the complexities of oil the impression of shale is often that it can be switched on and off like a tap, and chances are, it's not quite that simple.
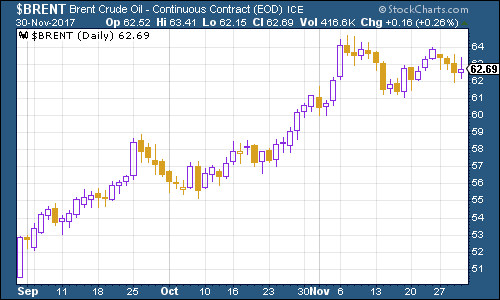
(Brent crude oil: three months)
Finally, internet giant Amazon took a bit of a knock this week as the tech-heavy Nasdaq index fell back, despite the other key US indices hitting new highs. However, analysts are falling over themselves to say nice things about the tech giant.
One of the lesser-known analysts got themselves a bit of a press by raising its price target for Amazon to $1,500 a pop. JP Morgan still likes it too, and Goldman Sachs reckons it can hit $1,450 in the next 12 months.
Is any of that likely? Pull a figure out of the air, write a story to justify it, massage the numbers to fit, and you can make anything look possible. But chances are what it really depends on is the momentum behind this bull market continuing.
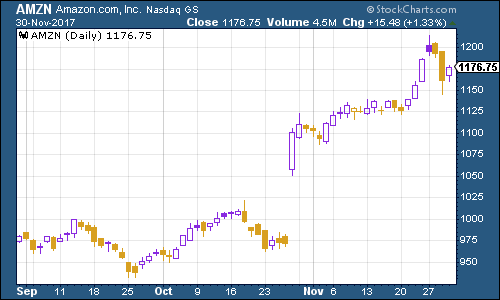
(Amazon: three months)
Get the latest financial news, insights and expert analysis from our award-winning MoneyWeek team, to help you understand what really matters when it comes to your finances.

-
 Average UK house price reaches £300,000 for first time, Halifax says
While the average house price has topped £300k, regional disparities still remain, Halifax finds.
-
 Barings Emerging Europe trust bounces back from Russia woes
Barings Emerging Europe trust has added the Middle East and Africa to its mandate, delivering a strong recovery, says Max King