Where has all the inflation gone?
Employment levels are high and credit is loose – so why on earth aren't prices rising, asks John Stepek.

Get the latest financial news, insights and expert analysis from our award-winning MoneyWeek team, to help you understand what really matters when it comes to your finances.
You are now subscribed
Your newsletter sign-up was successful
Want to add more newsletters?

Twice daily
MoneyWeek
Get the latest financial news, insights and expert analysis from our award-winning MoneyWeek team, to help you understand what really matters when it comes to your finances.

Four times a week
Look After My Bills
Sign up to our free money-saving newsletter, filled with the latest news and expert advice to help you find the best tips and deals for managing your bills. Start saving today!

Here's a question that's been puzzling economists and financial writers (including me) the world over.
The economy is growing maybe not as fast as people would like, but we're not currently in a recession by any conventional measure.
Meanwhile employment levels are hitting new highs on both sides of the Atlantic.
MoneyWeek
Subscribe to MoneyWeek today and get your first six magazine issues absolutely FREE

Sign up to Money Morning
Don't miss the latest investment and personal finances news, market analysis, plus money-saving tips with our free twice-daily newsletter
Don't miss the latest investment and personal finances news, market analysis, plus money-saving tips with our free twice-daily newsletter
And that's all before you get to the fact that credit is about as loose as it can get.
So where's all the inflation? How can the labour market be this tight and not drive up wages?
Well, on that topic, there's a very interesting point made in the weekly Halkin newsletter. They refer to a piece of research done by Jamie Dannhauser (who's a very smart chap) over at Ruffer, one of our favourite investment managers.
Dannhauser points out that if you look at people who are switching jobs, rather than those relying on annual pay rises from their current employer, then they're doing pretty well for themselves.
On average, people who change jobs are getting a pay hike of just over 8%. That compares to just 2%-ish for people sticking with their current jobs.
This is interesting. That means you now get paid the same sort of pay rise for changing job as you would have back in 2007, before the financial crisis battered everyone. Yet back then, pay growth for employees who stayed put was growing at 4%, nearly twice what it is now.
(Just to be clear, this has little to do with the 1% public sector pay freeze the size of private sector pay hikes has been pretty static too.)
Also, in 2007, inflation was higher (on average) than it is now. So in practice, "real" wage hikes are better now than they were then.
What could be driving this? If employers are willing to pay up for new hires, it certainly suggests that the market for the "right" sort of employee is tight.
Equally, it's very possible that employers can get away with keeping existing employees on modest pay hikes, because people are still rattled after 2008. So, you have a small pool of staff who can command better money for switching jobs, but employers aren't yet overly worried about retention.
It'll be interesting to see how that changes over the coming months. If the economy stays strong always a big "if" then it can surely only be a matter of time before retention becomes a bigger issue.
And in Britain specifically, there's the issue of immigrant workers being harder to find in the post-Brexit vote era. How much difference will that make? Apparently none at the top, end but at the lower end, it'll be interesting to see.
The charts that matter
Over to our charts that matter. A couple of big themes coming out this week the breakdown of the US dollar is one, and the growing evidence of a "PBoC put" (I'll explain that one in a moment).
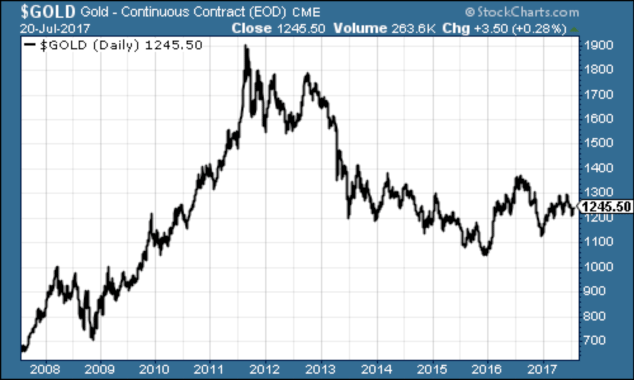
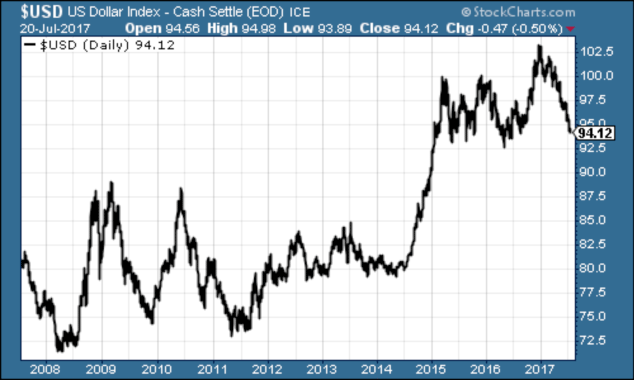
I've decided to make this section more useful by keeping the ten-year chart for context, but introducing the past three months' chart so you can see what's actually happened this week better.
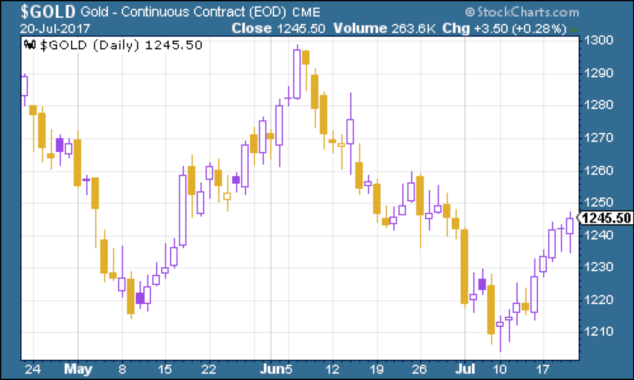
Gold has bounced back solidly this week, gaining about $20 an ounce or so. The weak dollar has played a major role in this. At the end of last week, US inflation came in lower than expected, and Federal Reserve boss Janet Yellen was more dovish than expected. So the idea which was prevalent at the start of this year, remember that the US was going to be the only central bank in the world raising interest rates, has now been pretty resoundingly proved wrong.
It also helped that prior to this, investors had been getting gloomy on gold. If you follow the weekly "commitment of traders" reports, then gold "longs" dropped for the fifth week in a row last week. When expectations are low, it doesn't take much to surprise to the upside.
(Gold: three months)
(Gold: ten years)
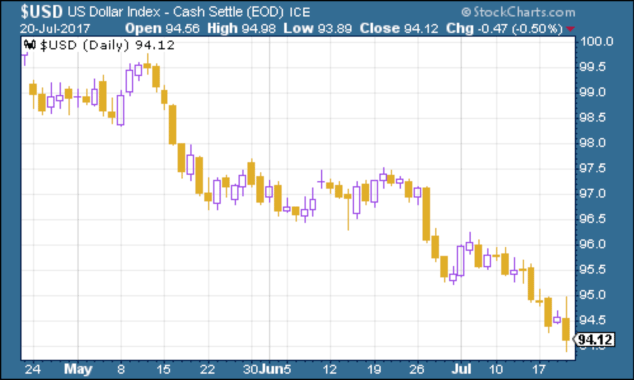
Second, the US dollar index tanked this week. Yellen played a role, but so did European Central Bank (ECB) boss Mario Draghi.
The market is feeling warm and fuzzy towards the euro again (remember that people were calling for the euro to fall to parity with the US dollar at the start of the year again, it's all about what's already in the price and what isn't).
Draghi doesn't really want the euro to go higher from here, but there's not a lot he can do about it with a German election coming up. With the euro accounting for a big chunk of the dollar index (which measures the dollar against a basket of the currencies of its biggest trading partners), it's little wonder the surging single currency helped to knock lumps out of the dollar this week.
(DXY: three months)
(DXY: ten years)
On ten-year US Treasury bonds these aren't quite sure of where to go right now. But with scepticism over the Fed's commitment to raising interest rates, and no sign of inflation, yields have ticked lower again.
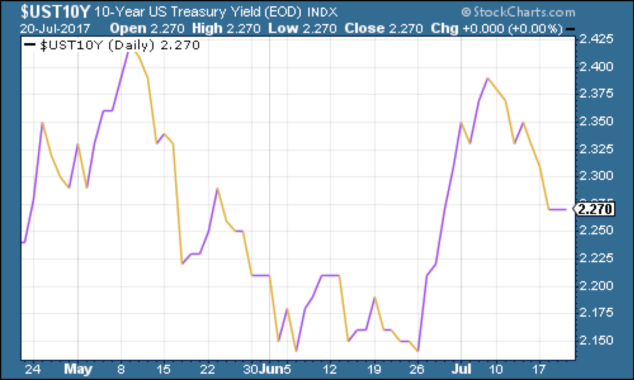
(Ten-year US Treasury: three months)
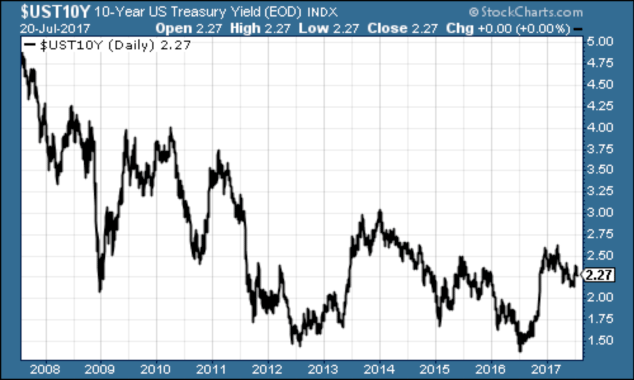
(Ten-year US Treasury: ten years)
Copper is making a comeback and it looks increasingly to me as though early May the French election marked a bit of a turning point for the miners and commodities in general.
However, it's also a result of the PBoC "put" this idea that the People's Bank of China, the Chinese central bank, and the Chinese government more widely, will not let the Chinese economy slow down sufficiently to cause any real damage to global economic growth.
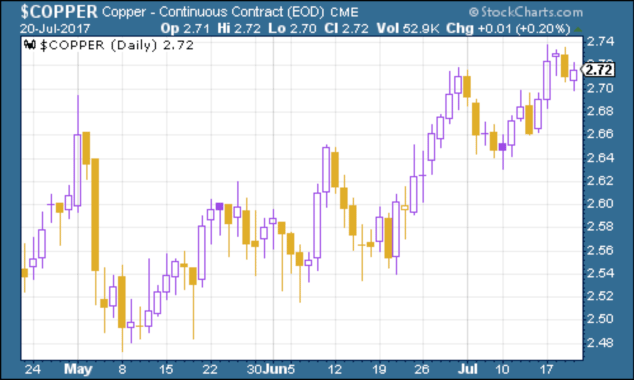
(Copper: three months)
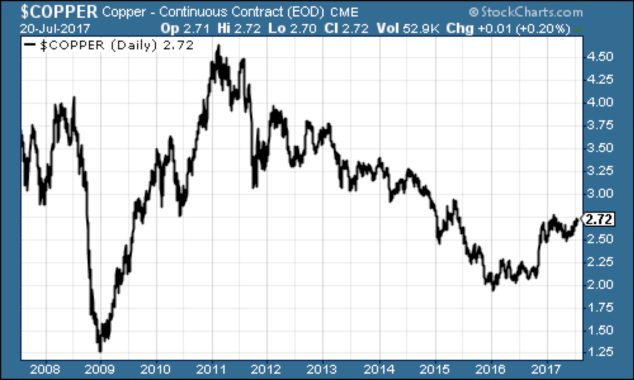
(Copper: ten years)
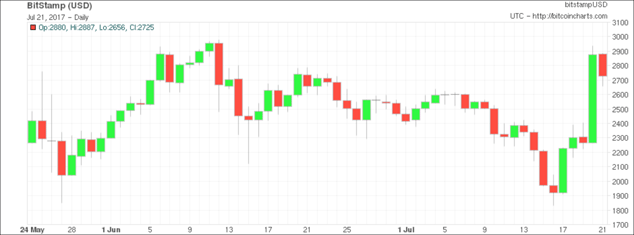
Bitcoin has had a good week too. That's mainly because a pending schism in the bitcoin community appears to have been settled, in that everyone agrees on a particular code upgrade that will make the cryptocurrency more manageable, says Bloomberg.
Sixth, there's theUS jobless claims data.David Rosenberg of Gluskin Sheff reckons this is a valuable leading indicator.When the figure hits a "cyclical trough" (as measured by the four-week moving average), a stock market peak is not far behind, and a recession follows about a year later.
This week, US jobless claims slid to an impressively low 233,000, versus expectations of 245,000. The four-week moving average slipped to 243,750, having hit its lowest level of the year on May 20th.
If that holds as the cyclical trough, then if Rosenberg is right (and to be fair, it's a small data set) we might be looking at a stock market peak later this year but it looks quite possible that the numbers could get even lower.
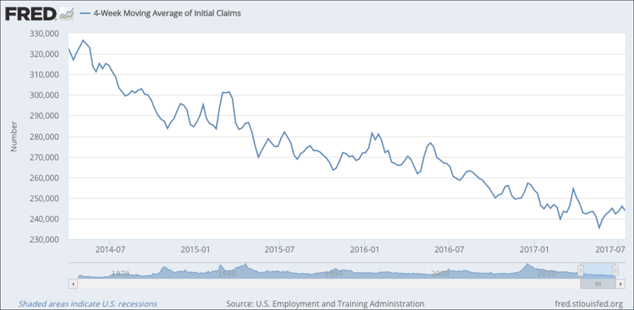
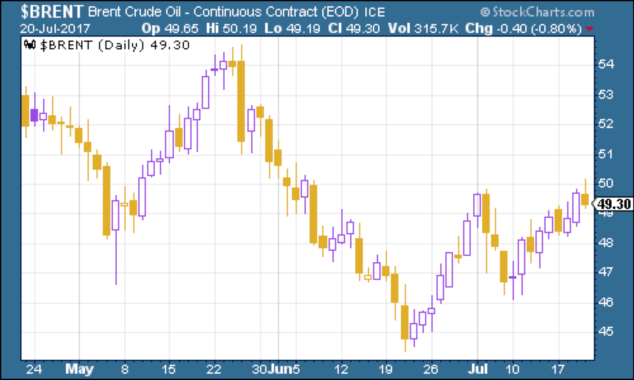
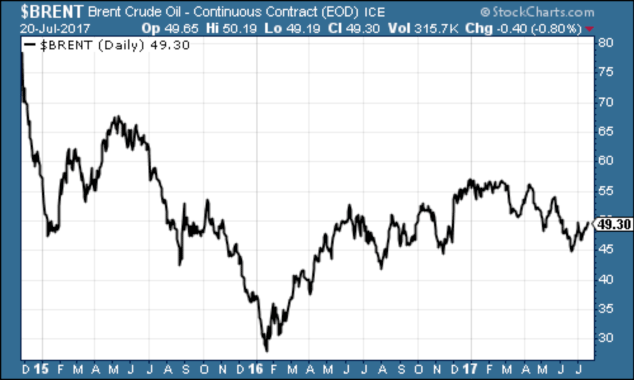
Chart number seven is the oil price (as measured byBrent crude, the international/European benchmark). Oil has continued to rally this week, although it seems a little shy of the $50 a barrel mark.
Finally there's, Amazon. This week, the wider US tech sector finally regained the heights it last saw in 2000 and Amazon made a new high (we're not talking about the Nasdaq by the way this is the S&P 500 IT sector).
A lot of people argue that the quality of the companies is now a lot higher they make profits, they have big networks, and all the rest of it. But the FT's Lex column makes a good point.
According to Goldman Sachs, in 2000, some of the companies at the top of tech sector Oracle and Microsoft, for example during the last bubble, were actually more profitable on some measures than the ones that are at the top now.
That's food for thought. Particularly as, according to the Wall Street Journal, short sellers are now throwing in the towel, having been battered by the apparently never-ending gains seen in the US market. Short interest in the S&P 500 is now at its lowest since May 2013, reports analytics firm S3 Partners.
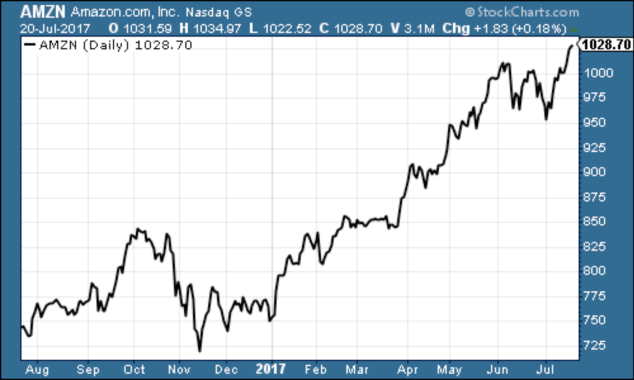
When the bears give up, you have to wonder who's left to keep buying?
Get the latest financial news, insights and expert analysis from our award-winning MoneyWeek team, to help you understand what really matters when it comes to your finances.

-
 Should you buy an active ETF?
ETFs are often mischaracterised as passive products, but they can be a convenient way to add active management to your portfolio
-
 Power up your pension before 5 April – easy ways to save before the tax year end
With the end of the tax year looming, pension savers currently have a window to review and maximise what’s going into their retirement funds – we look at how