Just how dear are stocks really?
Almost everybody agrees stocks are expensive, says Cris Sholto Heaton. But understanding what this means for future returns isn't so easy.

Get the latest financial news, insights and expert analysis from our award-winning MoneyWeek team, to help you understand what really matters when it comes to your finances.
You are now subscribed
Your newsletter sign-up was successful
Want to add more newsletters?

Twice daily
MoneyWeek
Get the latest financial news, insights and expert analysis from our award-winning MoneyWeek team, to help you understand what really matters when it comes to your finances.

Four times a week
Look After My Bills
Sign up to our free money-saving newsletter, filled with the latest news and expert advice to help you find the best tips and deals for managing your bills. Start saving today!

Almost everybody seems to agree that stocks are expensive today. Even those of us who favour stocks versus most other asset classes on the grounds that they are better value in relative terms as MoneyWeek does wouldn't claim that they are great value by past standards.
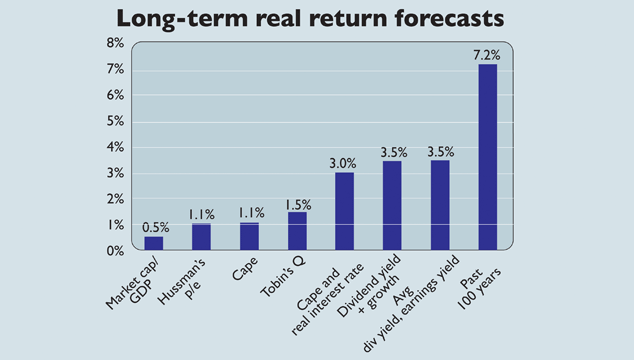
But knowing what this implies for future returns is harder than it sounds as a recent research note by Chris Brightman, Jim Masturzo and Noah Beck of investment firm Research Affiliates shows. They calculated the expected real (inflation-adjusted) return for the S&P 500 over the next ten years using seven different models.
The results are shown in the chart, benchmarked against the average return over the past 100 years. All the models forecast that returns will be lower than they have been historically. But beyond that, they vary from as little as 0.5% per year to as much as 3.5%.
MoneyWeek
Subscribe to MoneyWeek today and get your first six magazine issues absolutely FREE

Sign up to Money Morning
Don't miss the latest investment and personal finances news, market analysis, plus money-saving tips with our free twice-daily newsletter
Don't miss the latest investment and personal finances news, market analysis, plus money-saving tips with our free twice-daily newsletter
Why is there so much variation? It's because all these approaches work in different ways. The two on the right (dividend yield plus growth and average of dividend yield and earnings yield) are based on current earnings, dividends and valuations. They essentially assume that current levels of all these are typical and investors will earn a steady return from dividends and from growth fuelled by reinvested earnings.
If these assumptions are wrong for example, when earnings are unusually high, or when initial valuations are stretched the estimates they generate may be overstated.
Meanwhile, the four estimates on the left are based on relative valuations. They look at the current value of the stockmarket compared to some other financial metric and then compare that ratio to its long-term average. For example, the cyclically adjusted price/earnings ratio (Cape) compares the value of the market to average inflation-adjusted earnings over the past ten years, and then compares that figure to its long-run average.
These models should be better at identifying when stocks are overvalued and where investors are likely to suffer capital losses as valuations return to normal levels. All of them suggest that's likely now, because US stocks look dear.
But these approaches have their own limitations. They all suffer from the problem that the underlying relationships can change over time (see below). In addition, the value that investors put on stocks depends on other factors, such as economic conditions. When inflation is low and growth is good, investors will pay high prices. So a market that looks expensive is likely to revert to cheaper valuations eventually but it may not happen until economic conditions change.
Indeed, Research Affiliates' data suggest that when real interest rates were low, as they are now, the average return was around 3.0% even when Cape was as exceptionally high as it is today.
This helps to explain why valuation models are only modestly effective in predicting long-term returns. Both the dividend-based model and the Cape-based model explain only around 30% of subsequent ten-year returns, according to Research Afflilates. Hence basing your strategy on trying to make very accurate predictions is likely to be frustrating.
Forecasts imply that future returns will be lower than many expect. They also imply that US stocks are more expensive than the rest of the world. But that's probably about as precise as we can get.
Why valuation measures are imperfect tools
There's no compelling reason why the size of the stockmarket should be strongly related to the size of the economy over the long term, as there are many other factors that can affect the number and size of listed companies.
For example, a country with a strong culture of equity ownership and economic conditions that make it beneficial to be a listed company is likely to have a much larger stockmarket than a country with a tradition of private, family controlled companies.
However, the same is also true for other popular measures, such as Cape. The idea of Cape is simple. By comparing thevalue of the stockmarket to the average inflation-adjusted value of earnings over the past ten years, it irons out fluctuations in company earnings caused by the economic cycle.
Cape is then compared to its long-term average to work out whether the market is cheap or expensive compared to history. At the end of July, the S&P 500 traded on a Cape of around 27, which is 75% higher than its average since 1871.
But Cape today may not be directly comparable to the Cape of 50 years ago. Accounting differences, tax changes, and shifts in business spending and investment mean that today's earnings may differ significantly from those of decades ago. And the composition of the index has changed greatly over time.
So while Cape is probably correct in suggesting that the S&P 500 is expensive relative to history, the degree of overvaluation may be overstated because we are not comparing like with like.
Get the latest financial news, insights and expert analysis from our award-winning MoneyWeek team, to help you understand what really matters when it comes to your finances.

Cris Sholt Heaton is the contributing editor for MoneyWeek.
He is an investment analyst and writer who has been contributing to MoneyWeek since 2006 and was managing editor of the magazine between 2016 and 2018. He is experienced in covering international investing, believing many investors still focus too much on their home markets and that it pays to take advantage of all the opportunities the world offers.
He often writes about Asian equities, international income and global asset allocation.
-
 Barings Emerging Europe trust bounces back from Russia woes
Barings Emerging Europe trust has added the Middle East and Africa to its mandate, delivering a strong recovery, says Max King
-
 How a dovish Federal Reserve could affect you
Trump’s pick for the US Federal Reserve is not so much of a yes-man as his rival, but interest rates will still come down quickly, says Cris Sholto Heaton