Get the latest financial news, insights and expert analysis from our award-winning MoneyWeek team, to help you understand what really matters when it comes to your finances.
You are now subscribed
Your newsletter sign-up was successful
Want to add more newsletters?

Twice daily
MoneyWeek
Get the latest financial news, insights and expert analysis from our award-winning MoneyWeek team, to help you understand what really matters when it comes to your finances.

Four times a week
Look After My Bills
Sign up to our free money-saving newsletter, filled with the latest news and expert advice to help you find the best tips and deals for managing your bills. Start saving today!
This feature is part of our FREE daily Money Morning email. If you'd like to sign up, please click here: Sign up for Money Morning
"Be a genius in a bear market and dumb in a bull market," goes the saying.
I kind of agree. Find a bull market, go long then go to the beach. You'll do as well as those who are staring at screens all day.
MoneyWeek
Subscribe to MoneyWeek today and get your first six magazine issues absolutely FREE

Sign up to Money Morning
Don't miss the latest investment and personal finances news, market analysis, plus money-saving tips with our free twice-daily newsletter
Don't miss the latest investment and personal finances news, market analysis, plus money-saving tips with our free twice-daily newsletter
I've a friend who went long gold via a spreadbet when it was at $300 an ounce and never closed his position. In fact he occasionally added to it. That one simple trade has netted him more than half a million pounds.
There's no doubt that precious metals are in a bull market. Anyone but Gordon Brown can see that. But if you'd bought gold in May 2006, despite the sun, sea and sand, it would have been eighteen depressing, stressful months before your trade moved into profit.
So that's why I'm going to try to give you a few tips here on how to choose the right times to buy and the best times to sell
Technical analysis (TA), or charting, can seem like another world. The basic principle is simple. Markets reflect the behaviour of buyers and sellers, who are moved by predictable patterns of greed and fear. So by monitoring price movements, you can work out when markets are approaching a good time to sell or to buy (for more on this, see the piece on Dow Theory in the latest issue of MoneyWeek: Chartists say: sell out of US markets now). Also, Tom Stevenson had a very good piece on this topic in yesterday's Telegraph.
The underlying theory is simple enough. But when the professionals start talking about stochastics, Fibonacci retracements and RSI indicators, I must say I'm baffled. These tools might work, but what on earth are these people on about? And trendy lingo aside, do they actually make money?
But a simple bit of TA can help you find the right buy point, before you head off with your surf board and suntan lotion. Here are two simple technical tools to help you trade gold.
1. The 300-day moving average.
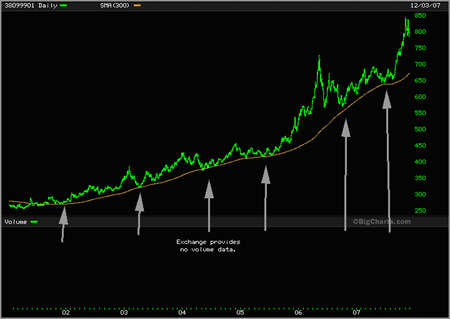
The 300-day moving average is a line showing the average price for the previous 300 trading days. In the chart below, which shows gold since 2001, you can see how gold has returned to the 300-day moving average (yellow line) but never gone through it. In fact, gold touching its moving average has consistently marked excellent buying opportunities, as marked by the arrows.

If gold returns to its 300-day moving average, but its fundamentals remain strong (ie central banks are still inflating the money supply), then buy, buy, buy.
2. Straight Lines
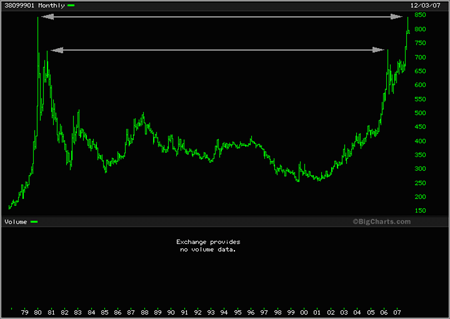
Simply drawing straight lines can mark obvious inflection points. Looking at the long-term gold chart, the May 2006 high and the resistance we are now seeing at $850 are obvious.

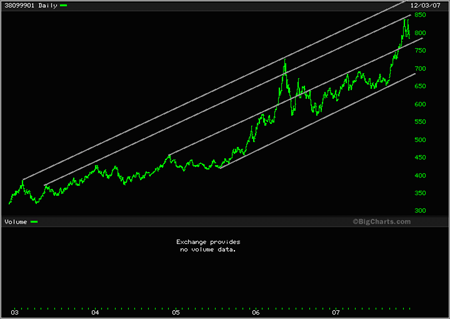
You can also use simple straight lines to identify trend channels and thus price entry and exit points.

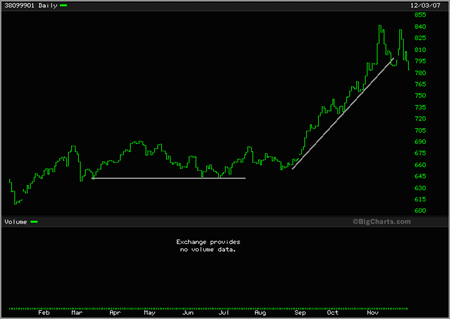
Sooner or later gold breaks above or below trend lines and channels. In the chart below showing gold this year, we see strong support at $645, then a nice trend up. But gold broke down through that trend line in mid-November.

It looks like we may have what is known as a double top' in place and gold needs to move lower to find a bottom before making its next move up. It may be that it has also made a double bottom around $780 and will now range-trade between $780 and $845.
But its movement is so violent at the moment I would have thought it unlikely to trade for long within that range. If it breaks to the downside an obvious support point would be the May 06 high (see chart 2). I doubt for now that we'll see any return to the 300 day moving average.
The long-term trend lies very much to the upside and I remain of the view that we'll see thousand dollar gold by the spring - but with plenty of nasty surprises on the way.
Turning to the wider markets
Enjoying this article? Why not sign up to receive Money Morni ng FREE every weekday? Just click here: FREE daily Money Morning email
Financials out of favour once again
In London, Banking stocks weighed heavily yesterday following a negative note from broker Morgan Stanley on RBS and Lloyds TSB. The FTSE 100 index ended the day 71 points lower, at 6,315. For a full market report, see: London market close
On the Continent, blue-chips stocks fell as Wall Street opened lower. The Paris CAC-40 was 82 points lower, at 5,547, and the Frankfurt DAX-30 fell 28 points to end the day at 7,808.
On Wall Street, US stocks closed a second straight session lower as financials including American Express, JP Morgan and Citigroup weighed. The Dow Jones closed 65 points lower, at 13,248. The tech-rich Nasdaq lost 17 points to close at 2,619. And the S&P 500 was off 9 points, at 1,462.
Asian stocks closed higher today. The Japanese Nikkei added 128 points to close at 15,608, with Mizuho Financial one of the day's biggest risers on news that it is to put $1.4bn into its brokerage unit to counteract subprime losses. And in Hong Kong, the Hang Seng was 465 points higher, at 29,345.
Houses prices fall for third month straight
Crude oil futures were little changed this morning, at $88.65, as investors awaited an announcement from Opec. And in London, Brent spot had risen to $90.52.
Spot gold hit an intra-day high of $806.70 today, before falling back to $803.50. And silver had edged up to $14.33.
In the currency markets, the pound was at 2.0384 against the dollar and 1.3837 against the euro. And the dollar was at 0.6787 against the euro and 110.20 against the Japanese yen.
And in London this morning, HBOS was the latest mortgage lender to report falling house prices. A report published today revealed that the average cost of a home fell 1.1% in November - the third month in a row that prices have fallen - to £194,895.
Finally, our recommended articles for today...
What not to buy this Christmas
- The miserable economic outlook on both sides of the Atlantic makes you feel like staying in (with the heating turned down a notch) rather than heading for Oxford Street, says Merryn Somerset Webb. And when it comes to stocks, there are some sectors you won't want to go shopping for either. To find out what investments you should definitely avoid this year, click here: What not to buy this Christmas
Labour: the unnatural party of government?
- One poll last week gave the Conservatives their biggest lead over Labour since before Black Wednesday. That's no surprise, says Brian Durrant. With an increasingly wobbly economic outlook, we're no longer as forgiving of the government as we once were. For more on why Gordon Brown may cling on to power until the humiliating end, just as Major did, read: Labour: the unnatural party of government?
Get the latest financial news, insights and expert analysis from our award-winning MoneyWeek team, to help you understand what really matters when it comes to your finances.
MoneyWeek is written by a team of experienced and award-winning journalists, plus expert columnists. As well as daily digital news and features, MoneyWeek also publishes a weekly magazine, covering investing and personal finance. From share tips, pensions, gold to practical investment tips - we provide a round-up to help you make money and keep it.
-
 Adventures in Saudi Arabia
Travel The kingdom of Saudi Arabia in the Middle East is rich in undiscovered natural beauty. Get there before everybody else does, says Merryn Somerset Webb
-
 ISA fund and trust picks for every type of investor – which could work for you?
Whether you’re an ISA investor seeking reliable returns, looking to add a bit more risk to your portfolio or are new to investing, MoneyWeek asked the experts for funds and investment trusts you could consider in 2026

