What’s next for gold?
After its remarkable run of the last few years, the price of gold is taking a breather. And while we are still in a long-term bull market, we may not see new highs for some time yet, says Dominic Frisby. Here, he looks at what the future may hold for gold.
Get the latest financial news, insights and expert analysis from our award-winning MoneyWeek team, to help you understand what really matters when it comes to your finances.
You are now subscribed
Your newsletter sign-up was successful
Want to add more newsletters?

Twice daily
MoneyWeek
Get the latest financial news, insights and expert analysis from our award-winning MoneyWeek team, to help you understand what really matters when it comes to your finances.

Four times a week
Look After My Bills
Sign up to our free money-saving newsletter, filled with the latest news and expert advice to help you find the best tips and deals for managing your bills. Start saving today!
I'm not unduly worried about the gold price.
But when I saw it had dropped $40 yesterday from $1,700 an ounce to almost $1,660 in the space of just a few hours, I'll admit a concerned eyebrow was raised.
So I suppose a bit of hand-holding is in order today - even if it's only my own.
MoneyWeek
Subscribe to MoneyWeek today and get your first six magazine issues absolutely FREE

Sign up to Money Morning
Don't miss the latest investment and personal finances news, market analysis, plus money-saving tips with our free twice-daily newsletter
Don't miss the latest investment and personal finances news, market analysis, plus money-saving tips with our free twice-daily newsletter
Gold may not see fresh highs for at least another year
Let me start by re-visiting my forecast of several months back. By my reckoning, we wouldn't see new highs in gold for at least another year, ie not before autumn 2012, if not later.
I based this forecast on a simple, repeating pattern that gold makes when it gets ahead of itself. In the chart below, you can see gold's action since 2001. It's plotted on a logarithmic chart, as the pattern is clearer that way. (A logarithmic chart measures percentage gain on the y-axis as opposed to an arithmetic chart which measures price. So on a logarithmic chart, a move from 200 to 400 looks the same as 400 to 800 and so on).
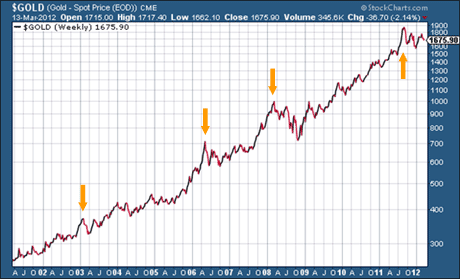
You can see what a lovely consistent ascent it's been.
But even within this steady uptrend there are times when it's got a little ahead of itself and then pulled back, as I've indicated in yellow on the chart. One example is in early 2003, another is in May 2006, another February 2008, and of course the same thing happened again in September 2011.
Each time it's done so, it's had a nasty fall, followed by a period of consolidation and digestion. And the more it's got ahead of itself, the bigger the fall and the longer the subsequent consolidation phase. I'm thinking in particular about the 18 months or so that followed the highs of May 2006 and February 2008.
On both occasions it was well over a year before gold made new highs. I believe we're in just such a period now. The high gold made last September at $1,920 was a typical example of gold going too far too fast. Now we have the consequent period of digestion.
So that's how I'm interpreting the big picture.
Gold measured in sterling is far less smooth
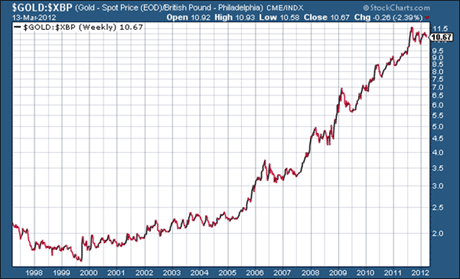
Out of interest, I present to you now the same chart, but of gold measured in pounds. The graceful ascendency is gone. This chart is hiccuping its way higher in steady, annual burps.
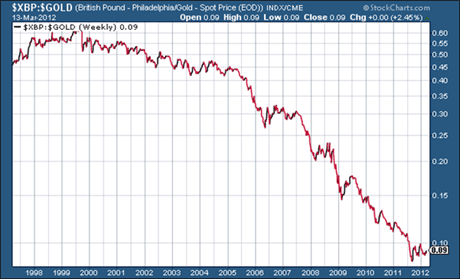
The inverse of this chart - which shows just how much the pound has fallen against gold - has the look of a geriatric stumbling blindly to his coffin.
The short-term outlook for gold
Now let's zoom in and take a look at the nearer term. Here is a one-year chart of gold.
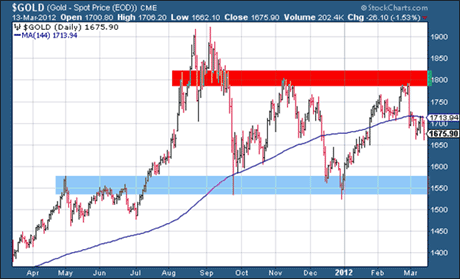
My famed 144-day moving average (blue line) has now become resistance, unfortunately. I see good support in the $1,550 zone, where I have drawn the light blue band. And I see resistance at $1,800 where I have drawn the red band.
These will be, I suspect, the two lines in the sand for the time being, probably until the autumn. Of course, these are just guesses - I know no more than you.
But again, staring at the chart and guessing, I suggest a retest of at least $1,600 looks to be on the cards before gold's normal, upwardly-mobile business can resume. But such a re-test, should it occur, would give a nice symmetry to the chart and add to that decent-looking base at $1,550.
Could the miners finally start to outperform?
As for silver, I see a similar picture with strong support at $26, but resistance at $38. Silver does seem to be displaying some relative strength, which is positive.
Also on the positive side of things, I am seeing some buying coming in to the junior resource sector. This is probably because of broader stock market strength, but I'm hoping we're in the early stages ofone of those periods when the stocks outperform the metals. Not before time, that's all I can say.
I've just come back from the PDAC in Toronto, which is the world's biggest mining conference. I must have spoken to over a hundred different companies while I was there. I'll be publishing my notes from the conference, as well as my pick of the PDAC in a new report, so watch this space.
And, finally, I've banished my inner Luddite and signed up for Twitter. I have 136 subscribers so far, so plenty of room for upside. If you're on Twitter, please follow me @dominicfrisby.
This article is taken from the free investment email Money Morning. Sign up to Money Morning here .
Our recommended articles for today
How capital cities can turn into parasites
Capital cities can be key drivers of a nation's economy. But if politics becomes corrupt, they can become huge, bloated parasites, sucking the life out of the rest of the country. Sen Keyes explains how.
The biggest bank scandal yet is unfolding now
A new insurance mis-selling scandal is emerging to eclipse that of PPI. And once again, the taxpayer will have to cough up, says Bengt Saelensminde. Here, he explains how to protect your wealth.
Get the latest financial news, insights and expert analysis from our award-winning MoneyWeek team, to help you understand what really matters when it comes to your finances.
MoneyWeek is written by a team of experienced and award-winning journalists, plus expert columnists. As well as daily digital news and features, MoneyWeek also publishes a weekly magazine, covering investing and personal finance. From share tips, pensions, gold to practical investment tips - we provide a round-up to help you make money and keep it.
-
 Three key winners from the AI boom and beyond
James Harries of the Trojan Global Income Fund picks three promising stocks that transcend the hype of the AI boom
-
 RTX Corporation is a strong player in a growth market
RTX Corporation’s order backlog means investors can look forward to years of rising profits

