Exchange-traded commodities: beware the contango gap
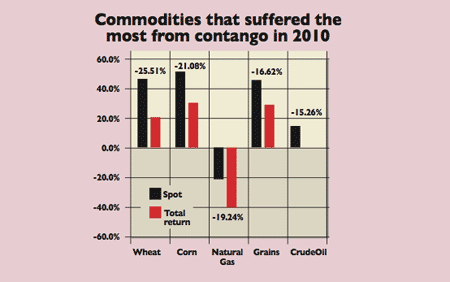
Investors on the exchange-traded commodity (ETC) market need to be aware of 'contango' - a phenomenon which cost nearly 20% in returns for five key commodity indices last year.

Get the latest financial news, insights and expert analysis from our award-winning MoneyWeek team, to help you understand what really matters when it comes to your finances.
You are now subscribed
Your newsletter sign-up was successful
Want to add more newsletters?

Twice daily
MoneyWeek
Get the latest financial news, insights and expert analysis from our award-winning MoneyWeek team, to help you understand what really matters when it comes to your finances.

Four times a week
Look After My Bills
Sign up to our free money-saving newsletter, filled with the latest news and expert advice to help you find the best tips and deals for managing your bills. Start saving today!
We've written before about the risks of investing in commodity trackers. The trouble is that, for a large part of the exchange-traded commodity (ETC) market, the shape of the commodity futures curve (effectively the price of contracts that allow you to buy or sell commodities in the future) has more impact on your returns than the movement in the price of the underlying raw material.
The chart below, from ETF issuer Source, makes this point clearly. The black bar shows the 2010 return for S&P's GSCI price index for the relevant commodity. That's the movement in the headline or spot' commodity price over the 12 months. The red bar is S&P's GSCI total return index what an investor actually achieves by buying a futures contract on the commodity in question, then rolling' it into a new one each month as the previous version expires.
The reason for the chasm between the red and black bars is contango'. This means that, when your commodity tracker sells the expiring futures contract each month and buys a new (longer-dated) one, it costs to do so. As the chart illustrates, contango cost investors nearly 20% in returns for five key commodity indices last year: wheat, corn, natural gas, grains and oil.
MoneyWeek
Subscribe to MoneyWeek today and get your first six magazine issues absolutely FREE

Sign up to Money Morning
Don't miss the latest investment and personal finances news, market analysis, plus money-saving tips with our free twice-daily newsletter
Don't miss the latest investment and personal finances news, market analysis, plus money-saving tips with our free twice-daily newsletter
Contango reflects the cost of storage, financing and insurance, and is inevitable for many commodities. Unfortunately, many investors in commodity trackers seem to have ignored this. Cash-flow figures suggest they have piled into particular areas of the market, hoping to take advantage of spot-price falls, while ignoring the effects of contango on their likely future returns.

Natural gas trackers the 20% fall in the commodity's spot price in 2010 doubled to a 40% loss after the costs of rolling futures were taken into account are a good illustration of this. In September 2009, the spot gas price fell to under US$3 per million British thermal units (MMBtu). This drew many investors to ETF Securities' natural gas ETC NGAS which topped $1bn. But even though the spot price now exceeds US$4 (it's up over 30%), NGAS's price is 52% lower than at the end of September 2009.
The lesson? If you're buying an exchange-traded product, you must understand how indices work and how their returns are generated. If you don't understand the methodology, don't touch it.
Paul Amery edits www.indexuniverse.eu
Get the latest financial news, insights and expert analysis from our award-winning MoneyWeek team, to help you understand what really matters when it comes to your finances.
Paul is a multi-award-winning journalist, currently an editor at New Money Review. He has contributed an array of money titles such as MoneyWeek, Financial Times, Financial News, The Times, Investment and Thomson Reuters. Paul is certified in investment management by CFA UK and he can speak more than five languages including English, French, Russian and Ukrainian. On MoneyWeek, Paul writes about funds such as ETFs and the stock market.
-
 Inheritance tax investigations net HMRC an extra £246m from bereaved families
HMRC embarked on almost 4,000 probes into unpaid inheritance tax in the year to last April, new figures show, in an increasingly tough crackdown on families it thinks have tried to evade their full bill
-
 Average UK house price reaches £300,000 for first time, Halifax says
While the average house price has topped £300k, regional disparities still remain, Halifax finds.
