Two more great wedge trading opportunities
John C Burford looks at two trading markets where spotting wedge patterns in the charts could yield tasty profits.
Get the latest financial news, insights and expert analysis from our award-winning MoneyWeek team, to help you understand what really matters when it comes to your finances.
You are now subscribed
Your newsletter sign-up was successful
Want to add more newsletters?

Twice daily
MoneyWeek
Get the latest financial news, insights and expert analysis from our award-winning MoneyWeek team, to help you understand what really matters when it comes to your finances.

Four times a week
Look After My Bills
Sign up to our free money-saving newsletter, filled with the latest news and expert advice to help you find the best tips and deals for managing your bills. Start saving today!
One of today's most hyped stockmarkets is surely the Japanese Nikkei 225. This index comprises 225 of the highest-rated Japanese companies and achieved notoriety in the 1980s when its value soared in a near-exponential bubble to reach the all-time peak of 40,000 in 1990, at the same time as the Dotcom bubble in the US indexes.
That, too, reflected the over-hyped stories that circulated at the time.
Here is a logarithmic chart of the index over the past 100 years. The huge bull market from about 1950 to the top in 1990 shows as a nearly straight line up on this logarithmic scale.
MoneyWeek
Subscribe to MoneyWeek today and get your first six magazine issues absolutely FREE

Sign up to Money Morning
Don't miss the latest investment and personal finances news, market analysis, plus money-saving tips with our free twice-daily newsletter
Don't miss the latest investment and personal finances news, market analysis, plus money-saving tips with our free twice-daily newsletter
If this were plotted on the usual arithmetic scale, it would look like an accelerating uptrend and I would need a few sheets of paper placed vertically to contain it!
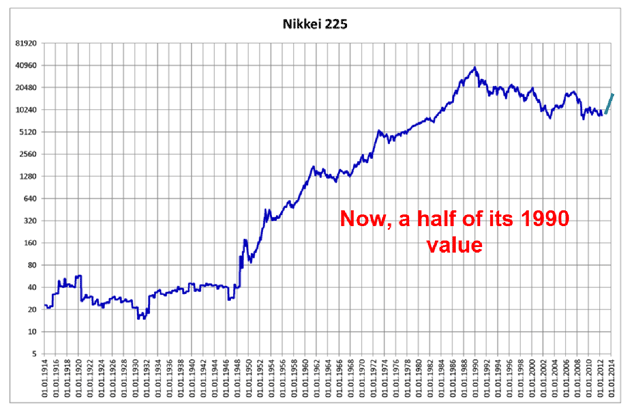
At the current 20,000 level, it has lost one half of its peak value. The decline doesn't look much on this log scale, but if you are still holding shares bought near the peak (as so many did), you are sitting on a huge inflation-adjusted loss in 25 years. Surely, even for the most die-hard buy-and-hold investor, patience would be wearing a little thin by now. And meanwhile, the Dow this year has just made its all-time high in May and many US shares bought 25years ago have greatly appreciated.
But what interests me is the short-term picture. Here is the daily chart showing the August swoon:
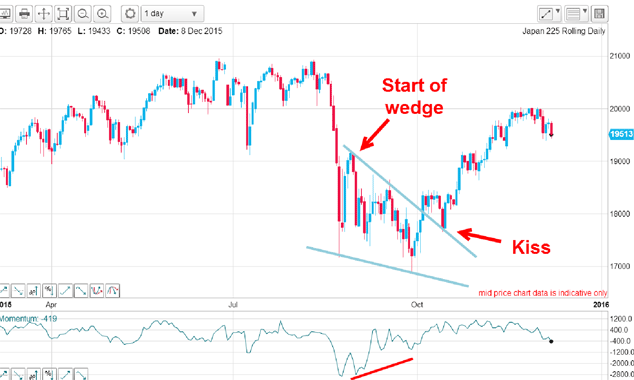
In September, the market consolidated in a beautiful wedge and made a huge positive-momentum divergence at its low. That was the signal to expect a very sharp snap-back rally if the upper wedge line could be penetrated.
And in October, the market did just that and after a traditional kiss, the strong rally ensued. Naturally, taking a long trade at the kiss was the perfect low-risk play. There was a little hesitation when the market hit the target area at the start of the wedge, but quickly overcame that.
But that is not all. The rally off the September low is forming another wedge on the hourly:
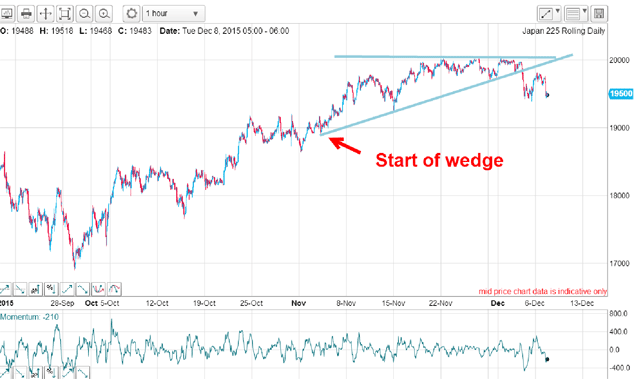
The rally has stalled at the round-number 20,000 level and has made several attempts to push above it all to no avail. And earlier this month, the market fell heavily through the lower wedge line to indicate a change of trend and set a target at the start of the wedge in the 19,000 area.
If achieved, a short trade would result in a tasty near 1,000-pip profit and for a swing trader, this is well worth going for.
The relief bounce in an attempted kiss fell way short, which indicated that the decline is likely to be severe (remember, I am writing this on 8 December). A failed kiss is usually a sign of underlying weakness.
If my target is reached, what would the wave picture look like then?
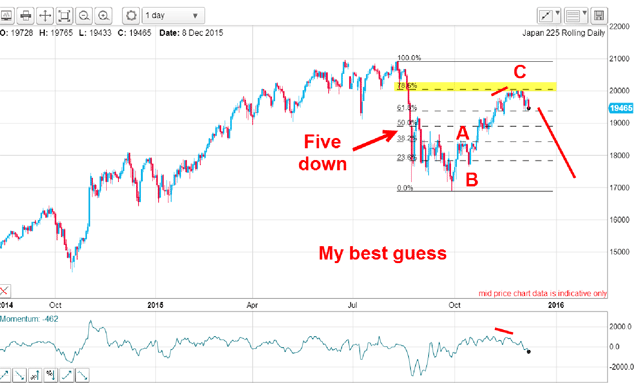
It would help confirm the above scenario. I have a five down off the 20,030 high with an A-B-C counter-trend rally where the C wave has hit the Fibonacci 78% resistance on the nose.
Crude oil
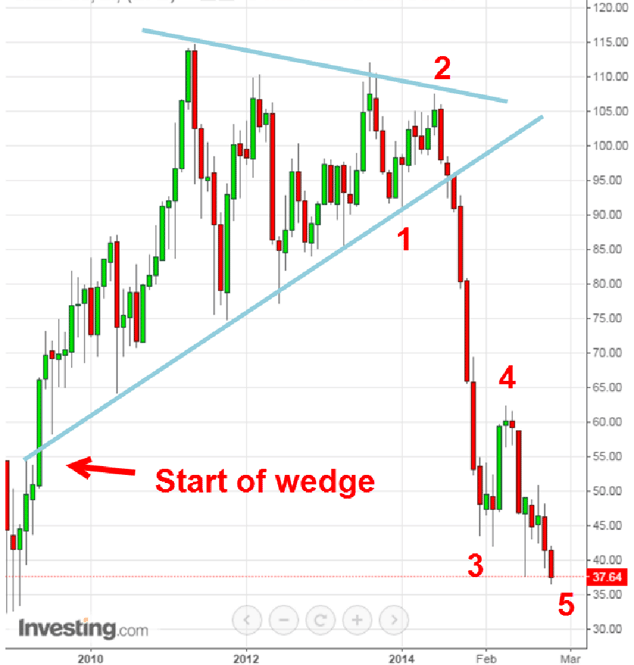
But the topping process over many months has formed a wedge with a striking lower support line which has multiple accurate touch points. This large-scale pattern is a reflection of the immense tension that gradually built up (remember my coiled spring analogy?) until the spring finally broke and propelled the market in a near-vertical collapse.
The decline paused briefly at the start of the wedge target, but with the global deflationary impulse in full swing, the market is making new lows as I write. This news is being covered almost daily on the front pages and thereby lies a clue as to the likely medium-term outlook for oil prices.
In terms of the Elliott waves, the waterfall decline cannot be much clearer we are in the final wave 5 down and when it ends, we shall see a counter-trend rally of some size.
My target has been the $60 area for some time (once wave 5 ends, of course). That is because relief rallies off an impulsive five down are aften contained at the wave 4 extreme in this case, the $60 region.
Get the latest financial news, insights and expert analysis from our award-winning MoneyWeek team, to help you understand what really matters when it comes to your finances.
John is is a British-born lapsed PhD physicist, who previously worked for Nasa on the Mars exploration team. He is a former commodity trading advisor with the US Commodities Futures Trading Commission, and worked in a boutique futures house in California in the 1980s.
He was a partner in one of the first futures newsletter advisory services, based in Washington DC, specialising in pork bellies and currencies. John is primarily a chart-reading trader, having cut his trading teeth in the days before PCs.
As well as his work in the financial world, he has launched, run and sold several 'real' businesses producing 'real' products.
-
 Average UK house price reaches £300,000 for first time, Halifax says
While the average house price has topped £300k, regional disparities still remain, Halifax finds.
-
 Barings Emerging Europe trust bounces back from Russia woes
Barings Emerging Europe trust has added the Middle East and Africa to its mandate, delivering a strong recovery, says Max King