The euro appears wobbly against the dollar
The latest events in Ukraine will put a lot of downward pressure on the euro. John C Burford looks at how that'll affect the longer-term trend.
Get the latest financial news, insights and expert analysis from our award-winning MoneyWeek team, to help you understand what really matters when it comes to your finances.
You are now subscribed
Your newsletter sign-up was successful
Want to add more newsletters?

Twice daily
MoneyWeek
Get the latest financial news, insights and expert analysis from our award-winning MoneyWeek team, to help you understand what really matters when it comes to your finances.

Four times a week
Look After My Bills
Sign up to our free money-saving newsletter, filled with the latest news and expert advice to help you find the best tips and deals for managing your bills. Start saving today!
It has been a while since I covered the EUR/USD cross and today, I thought I would update you on my analysis. There are some important developments taking place that merit my attention and I hope yours as well.
The reason for my recent neglect is simple: there was really not much going on until two weeks ago.
But with global markets increasingly on a knife-edge and the late news of the shooting-down of an airliner over the Russia-Ukraine border aiding nervousness financial markets are about to experience a lot more volatility.
MoneyWeek
Subscribe to MoneyWeek today and get your first six magazine issues absolutely FREE

Sign up to Money Morning
Don't miss the latest investment and personal finances news, market analysis, plus money-saving tips with our free twice-daily newsletter
Don't miss the latest investment and personal finances news, market analysis, plus money-saving tips with our free twice-daily newsletter
This will only serve to put upward pressure on the US dollar, and downward pressure on the euro.
The warning sign to watch for

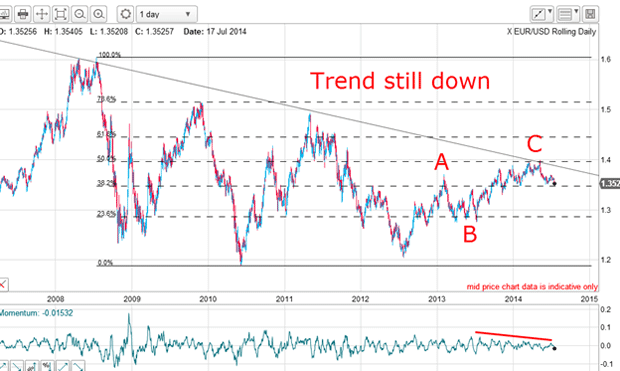
Clearly, the long-term trend remains down, and the rally off the 2012 low is in a clear A-B-C, which is always a counter-trend pattern. That means that when the C wave was in, the next immediate trend would be down.
This is one of my favourite trading setups, where I position with the major trend at the end of the counter-trend C wave.
When the market made it to the 1.40 level, where the Fibonacci 50% retrace met the downtrend line (huge resistance there), that capped off my C wave and the market turned down right on cue.
Note that momentum was losing steam all the way up to 1.40, warning me to get ready for a trend change.
Which way will the new trend go?

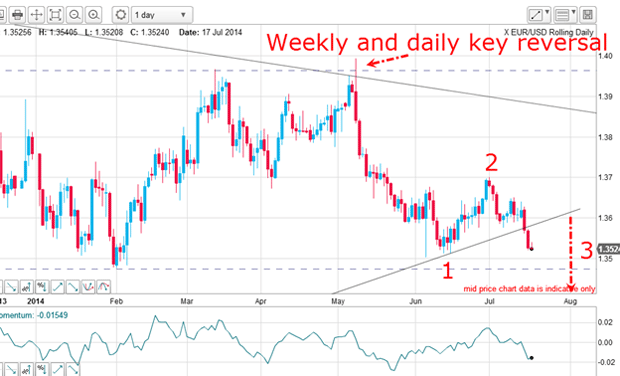
The key reversal on 8 May is a stand-out feature. It appears on both the daily and weekly charts.
A key reversal is a very important chart pattern that indicates a major trend change. The market rallied up to the 1.40 level and then was hit by heavy selling to produce a large pigtail and a much lower close on the day. That is a tell-tale sign that the market had run out of buyers and the new trend is down.
The move off the 1.40 level was swift and within a month, the market had lost five cents. It then found support on the trendline drawn off the July 2012 low and the July 2013 low.
For the remainder of June, the market drifted up in a relief rally before turning at the 1.37 level. The market broke below that support on Tuesday. That was a crucial break.
It was crucial because it helped confirm that the market is now very likely in a third wave down.
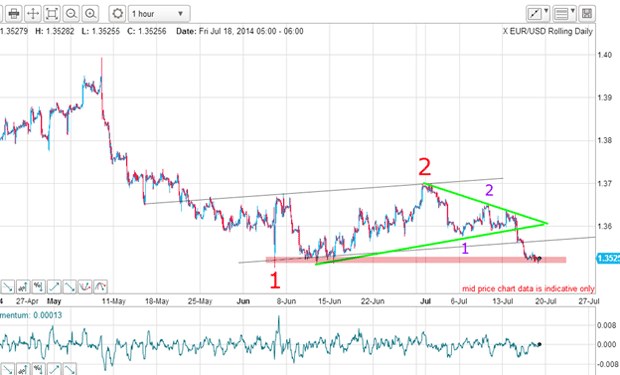
Also, I can count a smaller wave pattern with waves 1 and 2 off the wave 2 high at 1.37. The market is in this smaller wave 3 down.
That means we are in a third of a third' a very powerful pattern.
How to more accurately forecast wave direction

I have drawn a very good tramline pair and this week, the market has broken lower tramline support and is testing the chart support in the pink zone.
A solid low-risk trade entry was on the break of the green wedge at the 1.36 area. A slightly higher-risk entry was at the break of the lower tramline in the 1.3550 area.
One of the most useful features of Elliott wave theory is that if you have identified correct wave labels, you can make an accurate forecast for the direction and speed of the next move. Very few other methods can give you this vital information.
This setup offers huge potential profits

Here are the Fibonacci levels drawn off the large wave up from the July 2012 low. The market is currently testing the Fibonacci 23% support (as well as chart support). My main targets are the 50% and 62% levels, with the 38% level at 1.32 a major barrier.
The potential profits on this setup are huge, of course. A one-cent move is worth $1,000 for a basic £1 spread bet. For instance, if my 1.28 target is achieved, the potential profit is $8,000 for that £1 bet.
Longer-term, and if my wave labels are correct, the market should eventually reach the start of the A-B-C at the 1.22 area at least.
Those are the kinds of profits well worth working for!
Get the latest financial news, insights and expert analysis from our award-winning MoneyWeek team, to help you understand what really matters when it comes to your finances.
John is is a British-born lapsed PhD physicist, who previously worked for Nasa on the Mars exploration team. He is a former commodity trading advisor with the US Commodities Futures Trading Commission, and worked in a boutique futures house in California in the 1980s.
He was a partner in one of the first futures newsletter advisory services, based in Washington DC, specialising in pork bellies and currencies. John is primarily a chart-reading trader, having cut his trading teeth in the days before PCs.
As well as his work in the financial world, he has launched, run and sold several 'real' businesses producing 'real' products.
-
 Average UK house price reaches £300,000 for first time, Halifax says
While the average house price has topped £300k, regional disparities still remain, Halifax finds.
-
 Barings Emerging Europe trust bounces back from Russia woes
Barings Emerging Europe trust has added the Middle East and Africa to its mandate, delivering a strong recovery, says Max King