Stocks are being routed
The world’s stock markets are tumbling. And exciting times lie ahead for traders, says John C Burford, as the new bearish trend gets the bit between its teeth.
Get the latest financial news, insights and expert analysis from our award-winning MoneyWeek team, to help you understand what really matters when it comes to your finances.
You are now subscribed
Your newsletter sign-up was successful
Want to add more newsletters?

Twice daily
MoneyWeek
Get the latest financial news, insights and expert analysis from our award-winning MoneyWeek team, to help you understand what really matters when it comes to your finances.

Four times a week
Look After My Bills
Sign up to our free money-saving newsletter, filled with the latest news and expert advice to help you find the best tips and deals for managing your bills. Start saving today!
Yesterday was the 69th anniversary of D-Day the Allied invasion of Normandy. It was a turning of the tide in the war and I couldn't help thinking we are in a similar position in the markets today.
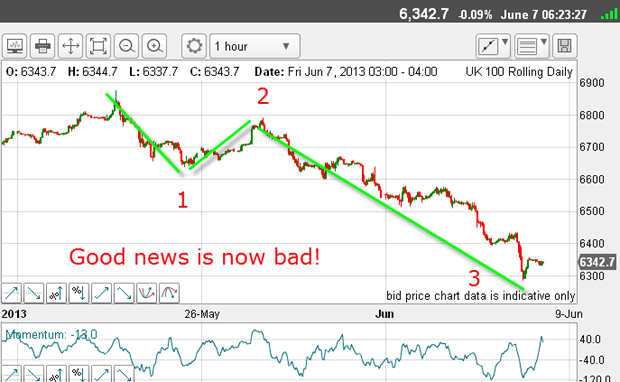
One clue was provided this week when very encouraging' UK economic data was released. This is how the FTSE reacted:

That good' news was not gratefully received!
MoneyWeek
Subscribe to MoneyWeek today and get your first six magazine issues absolutely FREE

Sign up to Money Morning
Don't miss the latest investment and personal finances news, market analysis, plus money-saving tips with our free twice-daily newsletter
Don't miss the latest investment and personal finances news, market analysis, plus money-saving tips with our free twice-daily newsletter
Since 22 May the FTSE has declined by around 9% - this is the date I said would be a historic turning point.
Yes, when third waves get going, they are relentless. I mentioned last time that we are in third waves of three degrees a most powerful set-up.
As for the news, in Thursday's newspapers, there were reports of the UK services sector "surging" in May, fuelling hopes that the UK's economic recovery was gathering momentum.
The services index registered 54.9 in May, higher than many in the City expected.
Here is one typical comment from the chief economist at Markit: "The UK economy has moved up a gear with all cylinders now firing". I have a feeling he will require more than salt and pepper to digest these words
So why did the FTSE collapse?
It'd take some fancy footwork to explain how the news drove this turn in the market!
But some things never change in the US, there are TV and radio stations devoted entirely to a 24-hour outpouring of financial matters. I know, I appeared on one of them at one time!
The entertainers who run these outlets peddle the myth that it is the news that matters. And there's never a shortage of that.
No, the FTSE collapsed because the mood has changed (see my previous posts).Before, with the bull racing ahead, both good and bad news was good. Now, all news is bad! This is what happens when a bull market turns into a bear market.
At major tops, most people are very bullish that is their bias. And when the market turns, they call the dip a normal technical correction' to be later retraced.
This last assumption is a trap. Investors have been so used to buying the dips that they cannot conceive that this dip' might be their last!
Hedge funds burned by the Nikkei
Here is the latest commitments of trader data on the Nikkei:
| NIKKEI INDEX X JPY 500 | Row 0 - Cell 1 | Row 0 - Cell 2 | Row 0 - Cell 3 | Open interest: 93,321 | ||||
| Commitments | ||||||||
| 35,129 | 6,725 | 2,916 | 42,709 | 30,445 | 80,754 | 40,086 | 12,567 | 53,235 |
| Changes from 21/5/13 (Change in open interest: -2,268) | ||||||||
| -2,846 | -2,593 | 1,465 | -4,162 | -5,915 | -5,546 | -7,046 | 3,278 | 4,778 |
| Percent of open interest for each category of traders | ||||||||
| 37.6 | 7.2 | 3.1 | 45.8 | 32.6 | 86.5 | 43.0 | 13.5 | 57.0 |
| Number of traders in each category (Total traders: 100) | ||||||||
| 30 | 12 | 5 | 42 | 26 | 73 | 42 | Row 8 - Cell 7 | Row 8 - Cell 8 |
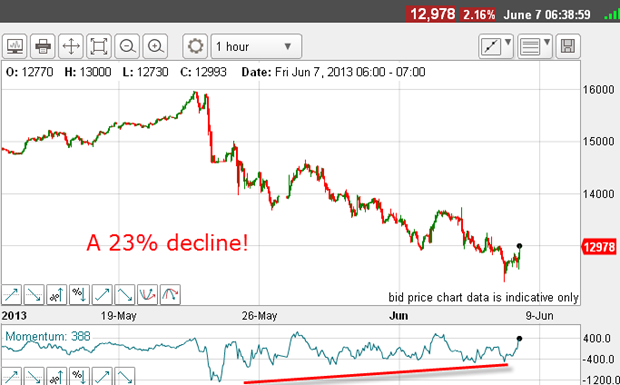
This is the shock and awe of the collapse:

That is what happens when major Elliott waves complete their traverse, and a new wave set takes over proceedings.
Most investors are unable to see the transformation in sentiment and still cling to their views as the market sinks. When they finally realise that the game has changed, that is when they begin selling their shares - after reading several gloomy articles, no doubt.
This is herding, of course.
And that is when major lows are formed when capitulation takes hold.
Incidentally, in the Nikkei chart, there is a large positive momentum divergence on the hourly chart. A bounce is in the works. And there were several good Fibonacci retracements on the way down why not run your Fib tool over the Nikkei and find the good short entries?
Also, the 23% decline qualifies the Nikkei as in a bear market a 20% fall is a commonly-accepted line in the sand.
Exciting times ahead for the Dow
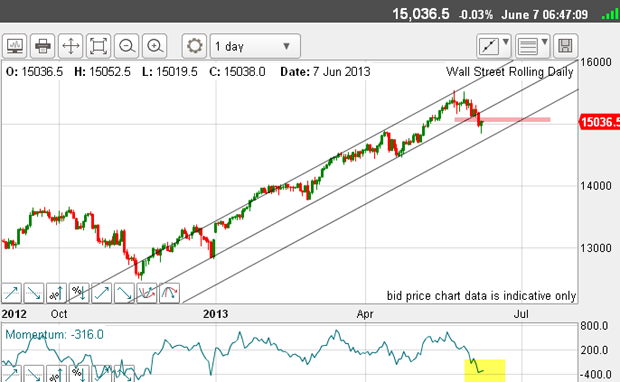
Here is the daily chart updated from Wednesday:

The centre tramline is now well and truly broken and the danger zone for the bulls (pink zone) that I showed last time has also given way.
This is a major shock to the system. Yes, I know many had called for a correction and many of these will expect a snap-back leading to new highs later in the year. We shall see.
But near-term, the Dow is oversold (I have highlighted the low momentum reading by way of evidence). Normally, this would indicate a large retracement is likely.
Yes, that is possible. But this time, I believe the bulls will be disappointed many of the largest declines in stock market history have started from an oversold reading. The brief rallies have spiked momentum up, but it soon gets pushed back to the floor.
Using the rally from November, a 50% correction (a typical retracement) would put a target in the 14,000 region a 1,000 pip move.
Later today, the US employment situation report will be released. As ever, the entrails will be picked over and the market will react.
But when a new trend gets the bit between its teeth, nothing can stop it, especially when the market is being driven by third waves of several degrees.
Very exciting times lie ahead.
If you're a new reader, or need a reminder about some of the methods I refer to in my trades, then do have a look at my introductory videos:
The essentials of tramline trading Advanced tramline trading An introduction to Elliott wave theory Advanced trading with Elliott waves Trading with Fibonacci levels Trading with 'momentum' Putting it all together
Don't miss my next trading insight. To receive all my spread betting blog posts by email, as soon as I've written them, just sign up here
Get the latest financial news, insights and expert analysis from our award-winning MoneyWeek team, to help you understand what really matters when it comes to your finances.
John is is a British-born lapsed PhD physicist, who previously worked for Nasa on the Mars exploration team. He is a former commodity trading advisor with the US Commodities Futures Trading Commission, and worked in a boutique futures house in California in the 1980s.
He was a partner in one of the first futures newsletter advisory services, based in Washington DC, specialising in pork bellies and currencies. John is primarily a chart-reading trader, having cut his trading teeth in the days before PCs.
As well as his work in the financial world, he has launched, run and sold several 'real' businesses producing 'real' products.
-
 ISA fund and trust picks for every type of investor – which could work for you?
Whether you’re an ISA investor seeking reliable returns, looking to add a bit more risk to your portfolio or are new to investing, MoneyWeek asked the experts for funds and investment trusts you could consider in 2026
-
 The most popular fund sectors of 2025 as investor outflows continue
It was another difficult year for fund inflows but there are signs that investors are returning to the financial markets