Short-term trading with Elliott waves - a textbook gold trade
As the price of gold surged in late December, an opportunity arose to trade against the crowd. Here's a good example of how to use Elliott wave theory to cash in as a bull run ends.
Get the latest financial news, insights and expert analysis from our award-winning MoneyWeek team, to help you understand what really matters when it comes to your finances.
You are now subscribed
Your newsletter sign-up was successful
Want to add more newsletters?

Twice daily
MoneyWeek
Get the latest financial news, insights and expert analysis from our award-winning MoneyWeek team, to help you understand what really matters when it comes to your finances.

Four times a week
Look After My Bills
Sign up to our free money-saving newsletter, filled with the latest news and expert advice to help you find the best tips and deals for managing your bills. Start saving today!
As a swing-trading spread-better, I am on the lookout for situations that offer good profit/risk potential. These situations can be both long and short trades in any type of market conditions, whether it is in a bull run, a bear run, or just consolidating.
Gold is one of my favourite vehicles. It trades virtually 24 hours and is highly liquid. It also has the benefit of being the subject of intense speculation. Even professional money managers, who previously had dismissed gold as a 'barbarous relic', are now taking great interest in this market.
As a measure of the speculative fever surrounding gold, I have taken from the latest report (28 December) of the US Commodities Futures Trading Commission the breakdown of futures positions held by the 'managed money' group. These are mainly the hedge funds and represent the 'big money'. Managed money holds 180,000 contracts long, and 12,000 contracts short.
MoneyWeek
Subscribe to MoneyWeek today and get your first six magazine issues absolutely FREE

Sign up to Money Morning
Don't miss the latest investment and personal finances news, market analysis, plus money-saving tips with our free twice-daily newsletter
Don't miss the latest investment and personal finances news, market analysis, plus money-saving tips with our free twice-daily newsletter
You can see what has happened. Just about everyone has bought the gold story. We see forecasts of gold going to $2,000, then $3,000, and then the moon. Even the small independent trader is massively long gold (77,000 on the long side, and only 29,000 short).
I trade against the crowd, so naturally, I am looking for an opportunity to short gold against the crowd. With this degree of bullish mania, any dip could turn into a rout and big profits for the nimble.
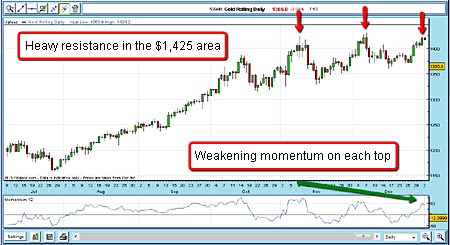
With my strategy in mind, in late December I was watching the market work its way higher towards the previous peaks in the $1425 area, which were made in early November and early December.

The market was forming a potential rare triple top. I believed that if this level held, there would be enough profit-taking and new short-selling to drive the market down in the rout I was expecting.
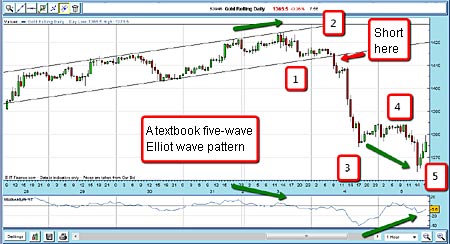
Bythen there was enough trading to form a very solid pair of tramlines on the hourly chart. I felt that if the market broke down below my lower tramline, that could be the start of my rout. Many sell-stops would then be touched, and a nice snowball selling pattern would ensue.

I then placed my entry sell orders just below the tramline and my order was filled on 4 January.
I decided to bet with £2 per pip, and my protective stop was placed at $1,420, as I reckoned that if the market rallied to that area, it would negate my analysis. This represents a potential loss of £160. My account had grown from the original £4,000 to over £5,000, and this higher risk was now justified.
4 Jan sell £2 rolling gold @ $1,412
Protective stop @ $1,420
Risk £160 (3% of account)
The market quickly dropped below support at $1,402 (the low of 30 December), and I lowered my protective stop to break-even, following my break-even rule.
I now recognised that we were in a possible wave three of a five-wave Elliott wave pattern, since the drop to the $1,385 area was so swift. This is the most important characteristic of a third wave they are most often sharp and swift, and it was forming right before my eyes.
OK, soit looked like we werein a potential five-wave pattern, but what should I expect now? Clearly, we had waves four and five to come. Wave four would be a short bounce off wave three, and then finally, wave five should drop beneath wave three, preferably on a positive divergence with momentum. I would be looking to take profits as close to the bottom of wave five as possible.
On 5 January, I was closely watching the market as it made the slight rally to wave four at $1,384, and then was delighted to see it drop below wave three to confirm my forecast of a minor five-wave Elliott wave pattern. According to Elliott wave theory, after a major bull run, if the market turns and makes a minor five-wave pattern down, that is almost certainly the end of the bull run.
My decision now was where to take profits a nice situation to be in.
As the market made it to $1,363, I was looking for a spot to exit the trade. As the positive divergence was so great, I expected a good rally. I pulled the trigger at $1,370 for a very satisfying two-day trade, where I caught a $42 move.
5 Jan bought £2 rolling gold @ $1,370
Profit 420 pips, or £840 on risk of £160
With Elliott wave forecasting, you need to make lots of assumptions. I had forecast a rapid move down below my tramline as sell-stops would be hit, and I based this forecast on the massively long market.
Incidentally, those on the matching short side are the trade mainly the miners that actually dig the stuff. They are simply hedging their production, current and future. Generally, they do not employ buy stops on their positions, whereas the speculative traders must and do. That is one reason why most of the time, when the market dips, there is a sea of red, while rallies in gold are grinding green and red affairs.
NB: Don't miss my next bit of trading advice. To receive all my spread betting blog posts by email, as soon as I've written them, just sign up here .
Get the latest financial news, insights and expert analysis from our award-winning MoneyWeek team, to help you understand what really matters when it comes to your finances.
John is is a British-born lapsed PhD physicist, who previously worked for Nasa on the Mars exploration team. He is a former commodity trading advisor with the US Commodities Futures Trading Commission, and worked in a boutique futures house in California in the 1980s.
He was a partner in one of the first futures newsletter advisory services, based in Washington DC, specialising in pork bellies and currencies. John is primarily a chart-reading trader, having cut his trading teeth in the days before PCs.
As well as his work in the financial world, he has launched, run and sold several 'real' businesses producing 'real' products.
-
 Average UK house price reaches £300,000 for first time, Halifax says
While the average house price has topped £300k, regional disparities still remain, Halifax finds.
-
 Barings Emerging Europe trust bounces back from Russia woes
Barings Emerging Europe trust has added the Middle East and Africa to its mandate, delivering a strong recovery, says Max King