You are now subscribed
Your newsletter sign-up was successful
Want to add more newsletters?

Twice daily
MoneyWeek
Get the latest financial news, insights and expert analysis from our award-winning MoneyWeek team, to help you understand what really matters when it comes to your finances.

Four times a week
Look After My Bills
Sign up to our free money-saving newsletter, filled with the latest news and expert advice to help you find the best tips and deals for managing your bills. Start saving today!
I covered the FTSE 100 market action in a recent post which covered the first period of post-Japan earthquake trading. I showed that the move up from the summer was well contained within my tramline pair I had drawn weeks ago.
The rally I could count as complete in five Elliott waves at the 6,100 top made in February. I then suggested that the most likely move would be down in a change of trend, having completed a classic five-wave impulse pattern.
MoneyWeek
Subscribe to MoneyWeek today and get your first six magazine issues absolutely FREE

Sign up to Money Morning
Don't miss the latest investment and personal finances news, market analysis, plus money-saving tips with our free twice-daily newsletter
Don't miss the latest investment and personal finances news, market analysis, plus money-saving tips with our free twice-daily newsletter
Here is that same chart updated to this morning:
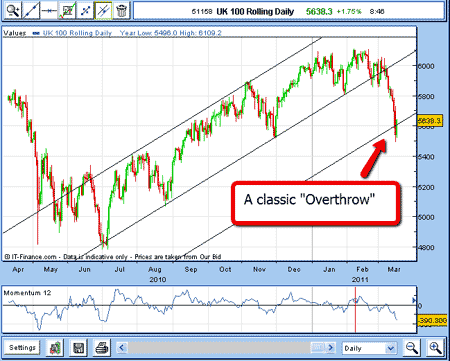
(Click on the chart for a larger version)
Since my previous post, the market has indeed plunged very rapidly to my lowest tramline (remember, it was drawn long before the market hit it!) and then overshot it before bouncing back.
This 'overshoot' effect is very common when markets are in free-fall (or free-rise!), and I fully expected it here.
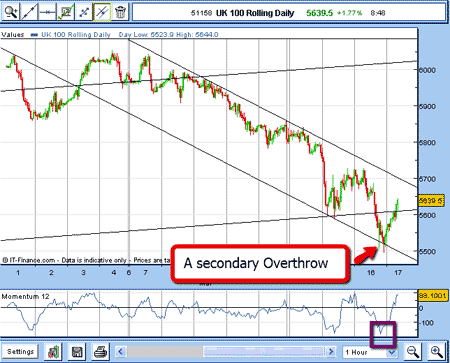
When a trend changes, hunt for new tramlines
But here is the interesting point when a market changes trend, it is a good idea to look for tramlines in the new down trend. And this is what I find in the hourly chart:
(Click on the chart for a larger version)
My upper down-sloping tramline I could draw a couple of days ago, which I did.
To find a valid lower tramline, I used my parallel line tool on my spread betting platform and hovered over the small high made on 1 March.
Lo and behold, it passed right through the first drop to the 5,600 level made last Tuesday. That was my second tramline in place.

Claim your FREE report: The 6-step game-plan for
spread betting profits
The market bounced from the 5,600 level, then fell again right to my new lower tramline and beyond in another 'overshoot'.
Of course, for short-term traders, this was a golden opportunity to take profits on their short trades. The odds then heavily favoured a significant bounce, especially now that momentum was so oversold (marked in the purple box).
As I write, we are seeing that good bounce. An ideal target is, of course, near the upper down-sloping tramline, as this is the operative set at present, while the market is in a broader downtrend.
But the market is hovering around my lower up-sloping tramline, and if this is still a force, the market may not rally too far from it.
We are living in volatile times, which means the trading opportunities are coming at us much more rapidly. If you are a trader, you need to be on your toes, as the swings are becoming wilder.
But using my tramline trading ideas, combined with Elliott wave, Fibonacci, and momentum indicators, it is possible to extract profits from these moves. I hope I am showing you how.
NB: Don't miss my next bit of trading advice. To receive all my spread betting blog posts by email, as soon as I've written them, just sign up here .
-
 MoneyWeek Talks: The funds to choose in 2026
Podcast Fidelity's Tom Stevenson reveals his top three funds for 2026 for your ISA or self-invested personal pension
-
 Three companies with deep economic moats to buy now
Opinion An economic moat can underpin a company's future returns. Here, Imran Sattar, portfolio manager at Edinburgh Investment Trust, selects three stocks to buy now

