What's the difference between traders and investors?
This spread-betting trade illustrates the difference between amateur investors and knowledgeable traders.
Get the latest financial news, insights and expert analysis from our award-winning MoneyWeek team, to help you understand what really matters when it comes to your finances.
You are now subscribed
Your newsletter sign-up was successful
Want to add more newsletters?

Twice daily
MoneyWeek
Get the latest financial news, insights and expert analysis from our award-winning MoneyWeek team, to help you understand what really matters when it comes to your finances.

Four times a week
Look After My Bills
Sign up to our free money-saving newsletter, filled with the latest news and expert advice to help you find the best tips and deals for managing your bills. Start saving today!
My trading style does not permit me to trade with the herd, especially when the public are heavily involved. I become very nervous when in bed with amateur investors. I do distinguish between "amateur" investors and knowledgeable traders here.
I would say that today, the stock market and now gold and silver are the two main markets where investors are heavily involved. Markets such as US Treasuries and currencies are dominated by traders. So what is the difference between a trader and an investor?
I could quote you the old saw that says: "A long-term investment is a trade that went wrong". However, to me the difference is one of attitude.
MoneyWeek
Subscribe to MoneyWeek today and get your first six magazine issues absolutely FREE

Sign up to Money Morning
Don't miss the latest investment and personal finances news, market analysis, plus money-saving tips with our free twice-daily newsletter
Don't miss the latest investment and personal finances news, market analysis, plus money-saving tips with our free twice-daily newsletter
An investor will invariably latch on to a 'story' surrounding a market, believe in it, and make the investment regardless of market timing considerations. A trader will put the background story aside and try to spot mis-pricing opportunities that they can exploit.
When sentiment gets to be too one-sided, that is usually a sign that the 'story' has been widely taken up by even amateur investors. That is when I begin looking for a spot to trade against the prevailing opinion.
A terrific example recently has been in the T-Bonds. These are the 30-year US Treasury bonds that have flooded the balance sheets of many a central bank (especially China) across the world. They are bought mainly by banks and financial institutions. Very few of the public buy them directly, although there are public funds that invest in them.
What is driving T-Bond prices?
One of the main things that is factored into T-Bond pricing is the perception of US inflation in the future. Not that anyone can possibly have any idea what level of inflation (or deflation) will be present years into the future.
Today, US inflation is low, short-term interest rates have been at rock bottom, and T-Bond prices have been driven up by safe-haven moves. The macro-economic factors such as the high (near 10%) unemployment rate, the large spare capacity in the economy, and the low growth in wage levels, have combined to spur bond buying this year.
But in the past few weeks, prices have been driven down by renewed fears over the inflationary implications of the planned quantitative easing (QE2) (and QE3?)money-printing programme by the US Federal Reserve.
The jump in yields (drop in prices) in November/December has been very rapid, and has even caught the imagination of headline writers in the mainstream press.
Even yesterday, here in the UK, the Bank of England has warned of impending interest rate rises, because they have been unable to control the high level of price inflation in the UK.
That is a sure sign the decline may soon be over. That scare has prompted selling.
Now, with bearishness in the US on Treasuries at record lows (the DSI Sentiment Index from trade-futures.com) to 13% bulls, I was looking for a low to trade off, and I didn't have long to wait.
From early December, I was following the market as it continued to side-step down. I felt that the 120 level (basis March) would be a good place to look for that low.
Ideally, I would like to see a new low accompanied by a positive divergence with momentum.

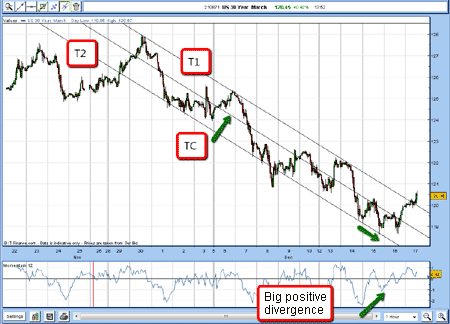
Then, on 15 December, I decided to draw some tramlines, as I spotted a nice, orderly decline.
First, I drew T1, which thankfully passed right through the tops on 30 November, 6 and 14 December. That gave me three beautiful points.
Using my parallel tool, I could see where my lower tramline, T2, could be placed.
My best fit kept the overshoot on 8 December outside, but I find markets can overshoot, and then rebound straight back inside.
Hovering over the chart, I could also draw TC, my central tramline, equidistant from the other two.
On 15 December, the market made a new low at 118.60, but on stronger momentum a potential positive divergence was being set up.

The snap-back begins
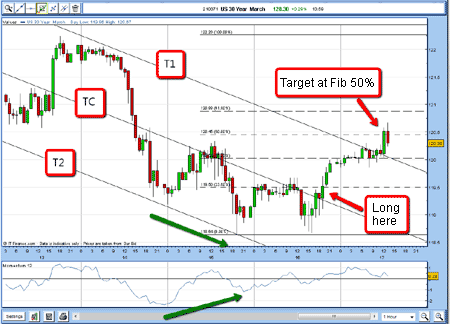
Then, on the next day, the market rallied right up to TC and I entered a buy order.
My stop was to be 50 pips away.
16 Dec buy £2 March T-Bond @ 119.30
Stop @ 119.80
Risk £100 (2% of account)
I felt that a rebound to the Fibonacci 50% retrace of the move down from the 13 December high to the 15 December low was probable, and I would take a short-term profit if it made it there.
The next day, the market did rally just past the Fibonacci level, and I was taken out for a short-term profit on my resting sell order.
17 Dec sell £2 March T-Bonds @ 120.45.
Profit £130.
I didn't want to hang around too long, as momentum on the hourly chart had corrected the oversold condition at the bottom.
When trading against the herd in this way, there is always the likelihood that any rally will be snuffed out by the selling of the tired (and losing) longs, who take the rally as a chance to get out with less damage to their equity. This selling can be severe, and that is why I like to make these trades hit-and-run, take the quick profit, and then see how the market develops from there.
Of course, there are many other ways to trade these situations. For instance, you could simply hold the trade and keep raising protective stops until taken out. That would offer you the possibility of making even bigger profits, but also the possibility of missing turns that could end up giving back hard-won profits.
As I maintain it is horses for courses, and as a trader, you have to pick your horse and have a trading plan.
Get the latest financial news, insights and expert analysis from our award-winning MoneyWeek team, to help you understand what really matters when it comes to your finances.
John is is a British-born lapsed PhD physicist, who previously worked for Nasa on the Mars exploration team. He is a former commodity trading advisor with the US Commodities Futures Trading Commission, and worked in a boutique futures house in California in the 1980s.
He was a partner in one of the first futures newsletter advisory services, based in Washington DC, specialising in pork bellies and currencies. John is primarily a chart-reading trader, having cut his trading teeth in the days before PCs.
As well as his work in the financial world, he has launched, run and sold several 'real' businesses producing 'real' products.
-
 Average UK house price reaches £300,000 for first time, Halifax says
While the average house price has topped £300k, regional disparities still remain, Halifax finds.
-
 Barings Emerging Europe trust bounces back from Russia woes
Barings Emerging Europe trust has added the Middle East and Africa to its mandate, delivering a strong recovery, says Max King