How to time a trade with the Fibonacci tool
Your spread-betting platform's Fibonacci tool is invaluable to help time trade entries and exits. Here's a good example of how to use it.
Get the latest financial news, insights and expert analysis from our award-winning MoneyWeek team, to help you understand what really matters when it comes to your finances.
You are now subscribed
Your newsletter sign-up was successful
Want to add more newsletters?

Twice daily
MoneyWeek
Get the latest financial news, insights and expert analysis from our award-winning MoneyWeek team, to help you understand what really matters when it comes to your finances.

Four times a week
Look After My Bills
Sign up to our free money-saving newsletter, filled with the latest news and expert advice to help you find the best tips and deals for managing your bills. Start saving today!
On my blog posts you will notice that I use my spread-betting platform's Fibonacci tool with abandon. I find this tool invaluable to help me time my trade entries and exits. It never fails to amaze me when tracking a market in real time, that more often than not, retracements of previous waves are turned back on or close to these levels.
So if I have identified the probable pivot points for a new wave, I apply my Fibonacci tool pronto.
Of course, there are several Fibonacci retracement levels for any one particular wave. You can see the main ones on your charts when you apply your Fibonacci tool. The big question is which will the market respect and turn back from?
MoneyWeek
Subscribe to MoneyWeek today and get your first six magazine issues absolutely FREE

Sign up to Money Morning
Don't miss the latest investment and personal finances news, market analysis, plus money-saving tips with our free twice-daily newsletter
Don't miss the latest investment and personal finances news, market analysis, plus money-saving tips with our free twice-daily newsletter
To help identify the likely Fibonacci level for a turn-around, I get some confirming help from other quarters. This recent trade in the USD/JPY (dollar/yen) currency cross illustrates this.
The trade USD / JPY

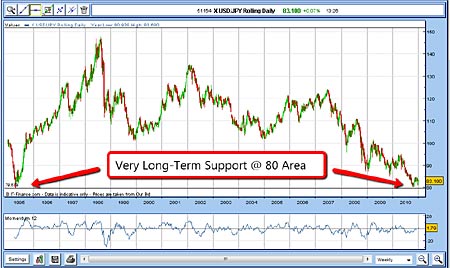
In late October, the market made a low just a few pips from the 1995 low and started rallying. Because sentiment here was so extreme, I was looking for at least a good bounce, which I managed to catch (I covered this in a previous post).
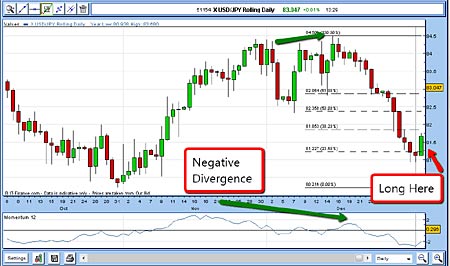
The market rallied to the 84.50 area in a month, then fell back. It then rallied once more to make a high just exceeding the 1 December high, but on reduced momentum. This therefore set up a possible negative divergence with momentum. As a result, I was then on the lookout for a fresh challenge to the 80 lows (see chart below).

Using Fibonacci to time my entry
Interestingly, the 7 December low at 82.30 was also the exact Fibonacci 50% retrace of this wave. Now, how did the market know this was a very important chart point on 7 December, before the high had been made?
As the market moved lower, I expected at least good support at the 76.4% level at around 81.20. Here, momentum was bombed out. The odds favoured a substantial bounce. I decided to enter a buy order with my protective stop at 80.50. If the market did take me out there, I felt new lows would be on the cards, and I didn't want to stick around for that.
4 Jan bought £2 rolling USD/JPY @ 81.35 Protective stop @ 80.50 Risk £170 (3% of account)
The rally gets under way
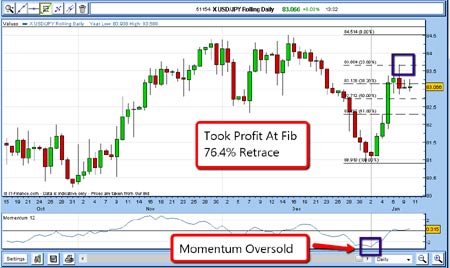
For a short-term trade, where could I take profits? Ideally, the rally would carry to a high Fibonacci retrace level on high momentum readings. And that's what I was looking out for.

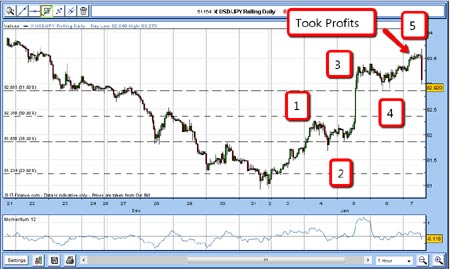
Then, on 7 January, the market made a dash for the 76.4% retrace at 83.65 and on high momentum. This was the time to exit.
Also, on the hourly chart, the rally off the low has occurred in a nice clean five-wave Elliott wave pattern (as you may recall, a five-wave pattern is followed by a reversal).

7 Jan sold £2 rolling USD/JPY @ 83.40 Profit £610 on risk of £170
Using Fibonacci retrace levels combined with momentum overbought/oversold readings and positive/negative divergences in this simple way can often provide terrific profits with excellent profit/risk ratios.
The key is to be patient and wait for your ducks to line up. If you trade just the major markets, which include the FTSE, Dow, S&P500, T-bonds, gold, crude oil, and the major currency crosses, you should be able to ferret out promising situations such as this one with surprising frequency.
Incidentally, I have found that in most individual stock charts, and minor currency crosses, the Fibonacci tool works much less well. So let your Fibonacci tool be your friend, and stick with the most liquid markets.
NB: Don't miss my next bit of trading advice. To receive all my spread betting blog posts by email, as soon as I've written them, just sign up here.
Get the latest financial news, insights and expert analysis from our award-winning MoneyWeek team, to help you understand what really matters when it comes to your finances.
John is is a British-born lapsed PhD physicist, who previously worked for Nasa on the Mars exploration team. He is a former commodity trading advisor with the US Commodities Futures Trading Commission, and worked in a boutique futures house in California in the 1980s.
He was a partner in one of the first futures newsletter advisory services, based in Washington DC, specialising in pork bellies and currencies. John is primarily a chart-reading trader, having cut his trading teeth in the days before PCs.
As well as his work in the financial world, he has launched, run and sold several 'real' businesses producing 'real' products.
-
 ISA fund and trust picks for every type of investor – which could work for you?
Whether you’re an ISA investor seeking reliable returns, looking to add a bit more risk to your portfolio or are new to investing, MoneyWeek asked the experts for funds and investment trusts you could consider in 2026
-
 The most popular fund sectors of 2025 as investor outflows continue
It was another difficult year for fund inflows but there are signs that investors are returning to the financial markets