The powerful waves washing over the euro market
Right now, the euro/dollar market is displaying some powerful and exciting Elliott waves, says John C Burford. Played well, they could lead to some very rewarding trades.
Get the latest financial news, insights and expert analysis from our award-winning MoneyWeek team, to help you understand what really matters when it comes to your finances.
You are now subscribed
Your newsletter sign-up was successful
Want to add more newsletters?

Twice daily
MoneyWeek
Get the latest financial news, insights and expert analysis from our award-winning MoneyWeek team, to help you understand what really matters when it comes to your finances.

Four times a week
Look After My Bills
Sign up to our free money-saving newsletter, filled with the latest news and expert advice to help you find the best tips and deals for managing your bills. Start saving today!
As I write early this Monday morning, the charts of the EUR/USD are shouting a message loud and clear to me we are not only in one third Elliott wave, but we are also in several third waves of differing degrees (or time scales).
I shall lay out my case here, but if you need to brush up on how I use the basic principles of Elliott waves, just go to my recent video tutorial. There, you will see why I love third waves! They are usually relentless and sweep all before them.
I believe we are in just such a pattern now with the euro.
MoneyWeek
Subscribe to MoneyWeek today and get your first six magazine issues absolutely FREE

Sign up to Money Morning
Don't miss the latest investment and personal finances news, market analysis, plus money-saving tips with our free twice-daily newsletter
Don't miss the latest investment and personal finances news, market analysis, plus money-saving tips with our free twice-daily newsletter
And when I spot a market that appears to be in several third waves simultaneously, I do get rather excited!
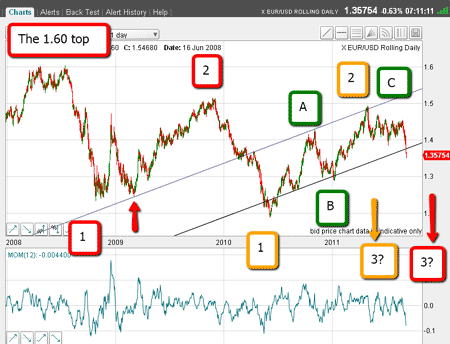
OK, here is the daily chart as of this morning:

(Click on the chart for a larger version)
There is a lot of information on this chart, so I will go over the important points:
I have drawn a very nice pair of tramlines with the significant point in 2009 marked by my red arrow. To understand why this point is important, watch my video tutorialThe essentials of tramline trading. Note how my upper tramline passes right through the major highs made this year. These are my green A and C waves.
From the all-time highs at 1.60 from 2008, the market swept down to red wave 1, then rallied to red wave 2.
And from red wave 2, the market moved down to yellow wave 1, then rallied up to yellow wave 2 (also green wave C).
This is the important point to note: Now the market has broken below my lower tramline, which means we are very likely in third waves in both the red and yellow degrees.
But that is not all!
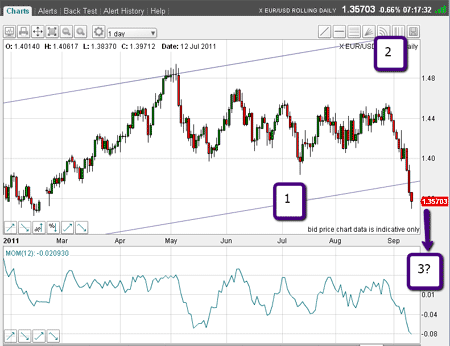
Here is a close-up of recent trading showing the yellow wave 2 and green wave C high made in May:

(Click on the chart for a larger version)
The action off this high has been very complex. Actually, it has given me kittens trying to trade! I tried a few short trades, but took some small losses.
I have marked the probable waves 1 and 2 in purple. Wave 3 lies underneath.
But I was convinced the market would eventually follow my Elliott wave script. It was a matter of biding my time.
Played properly, these waves could produce substantial returns
If my Elliott wave projections were correct, the rewards would be substantial, so I was willing to take these losses in anticipation.
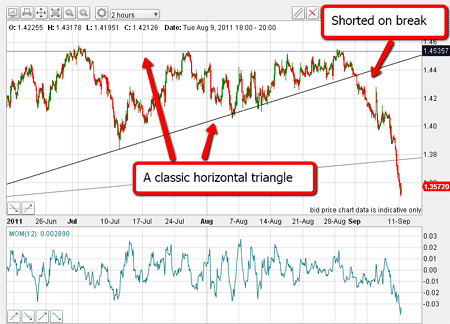
I was also following the market on the two-hourly chart through August and this month:

(Click on the chart for a larger version)
And when I spotted this classic horizontal triangle, I confess I raised an eyebrow or two.
A horizontal triangle is simply a triangle where the upper line is horizontal, and the lower line has a slope. If you wish to learn more on classical chart patterns, the 'bible' remains the 1947 Technical Analysis of Stock Trends by Edwards and Magee.
The significant point here is that the upper line passes through the 1.45 highs. And this high has held all attempts to rally up through it. This is powerful resistance a brick wall.
In traditional technical analysis, this pattern is one of the strongest in predicting a big move out of the triangle.
And when the market made a clear break out of the triangle, I placed my short sales on resting orders.
Keep focused to get the returns you want
Since then, the market has been following my Elliott wave script to the letter.
Of course, momentum readings are hugely oversold and the market will be vulnerable to sharp rallies to correct this condition.
But I will be looking to short these rallies, as the market is telling me it is in the grip of several powerful third waves and I have counted three of them already!
Short-term traders will be on the look-out for the minor degree fifth waves to take profits, as these are ending waves and often lead to good counter-trend moves.
But the larger degree patterns will still be in third waves, so down she goes. But already, the market is almost ten cents off my entry. That is a big and rapid move and typical of third waves.
The depth of the declines will stun most observers. The temptation will be to take profits too early. This is one reason many traders fail to capitalise on major moves.
But understanding the Elliott wave picture can keep you focused - and helpto produce those home runs we all want.
Never lose sight of the fact that as small individual traders, we are pitting our wits against some of the smartest people on the planet. Taking money from them is a major achievement and I admire anyone who can do it.
Don't miss my next trading insight. To receive all my spread betting blog posts by email, as soon as I've written them, just sign up here .
Get the latest financial news, insights and expert analysis from our award-winning MoneyWeek team, to help you understand what really matters when it comes to your finances.
John is is a British-born lapsed PhD physicist, who previously worked for Nasa on the Mars exploration team. He is a former commodity trading advisor with the US Commodities Futures Trading Commission, and worked in a boutique futures house in California in the 1980s.
He was a partner in one of the first futures newsletter advisory services, based in Washington DC, specialising in pork bellies and currencies. John is primarily a chart-reading trader, having cut his trading teeth in the days before PCs.
As well as his work in the financial world, he has launched, run and sold several 'real' businesses producing 'real' products.
-
 Average UK house price reaches £300,000 for first time, Halifax says
While the average house price has topped £300k, regional disparities still remain, Halifax finds.
-
 Barings Emerging Europe trust bounces back from Russia woes
Barings Emerging Europe trust has added the Middle East and Africa to its mandate, delivering a strong recovery, says Max King