Another leg of the Dow's bear market decline
As it teeters on the edge of another drop, the Dow Jones is displaying a classic example of how you can use John C Burford's tramline trading methods to time low-risk trades.
Get the latest financial news, insights and expert analysis from our award-winning MoneyWeek team, to help you understand what really matters when it comes to your finances.
You are now subscribed
Your newsletter sign-up was successful
Want to add more newsletters?

Twice daily
MoneyWeek
Get the latest financial news, insights and expert analysis from our award-winning MoneyWeek team, to help you understand what really matters when it comes to your finances.

Four times a week
Look After My Bills
Sign up to our free money-saving newsletter, filled with the latest news and expert advice to help you find the best tips and deals for managing your bills. Start saving today!
Just look at the Dow. It's throwing up an absolute classic example of how you can use my tramline method in timing your low-risk entries and crucially, getting the direction right!
To remind you, tramlines are lines on the chart of resistanceto rallies (upper) and support of dips (lower). If you're keen to make money from trading I encourage you to become expert at using tramlines and I have video tutorials available here to help you.
Today we'll keep looking at the Dow to help you get the hang of this.
MoneyWeek
Subscribe to MoneyWeek today and get your first six magazine issues absolutely FREE

Sign up to Money Morning
Don't miss the latest investment and personal finances news, market analysis, plus money-saving tips with our free twice-daily newsletter
Don't miss the latest investment and personal finances news, market analysis, plus money-saving tips with our free twice-daily newsletter
Using tramlines to gain a market edge
One extremely useful aspect of this method is that you can extend tramlines into the future and project where market turns are likely to occur.
Think about that. We have in our hands the Holy Grail of trading being able to look into the future with high accuracy!
I'm not claiming it's fail-safe. Of course, forecasting the future cannot be 100% accurate in any field, from sport to politics to technology to the weather. That's especially the case in the field of the quintessential human activity the financial markets.
But all we ask as traders is to have an edge over the coin-toss and the bigger the edge, the better our trading results. I believe my tramline method can give us that edge.
Naturally, there will be losers along the way as forecasts do not pan out. But when we keep these losses under control (using good money management rules) and let winners follow our game plan, we will rack up generous profits over time. That is how the pros do it and it's what I aim to show you.
We'll get to the latest Dow charts in a moment. But first, just one more important point: I rarely comment on the background macro economic situation in these articles. I'll tell you why.
Most of us base our market views (bullish, bearish or neutral) on an understanding of the economy, Fed policy, eurozone factors, and so on. And so do I to a large extent!
We trade our beliefs. But as a technical trader, my main focus is on my charts, and on the internal technical aspects, such as sentiment measures as discussed last Friday. That's what works for me.
OK, let's get right in to the Dow.
Sentiment readings show a big swing to the bear camp
On Friday, I gave my reasoning behind the 500-point rally as a huge short squeeze. To back my view up, below are the latest AAII survey results of sentiment of retail investors towards stocks:
| Week ending 7/18 | 22% | 42% | 36% |
| Change in week | -8% | 7% | 1% |
| Long-term average | 39% | 30% | 31% |
There was a 15% swing to the bearish camp. This is another huge swing, which has occurred several times before, as I have pointed out. The market is truly polarised!
But the huge 42% bearish reading does not mean that the 'moms and pops' have suddenly decided to short shares! This is the group that buys and holds equities for the long pull. But it does illustrate that public sentiment has turned negative and is being replicated throughout the investment world.
Public mood is turning more and more bearish and negative and this is being translated into action and a deflationary scenario.
With that 500-pip rally, many of the shorts have been shaken out of the tree. The stage is now set for another leg of the bear market decline.
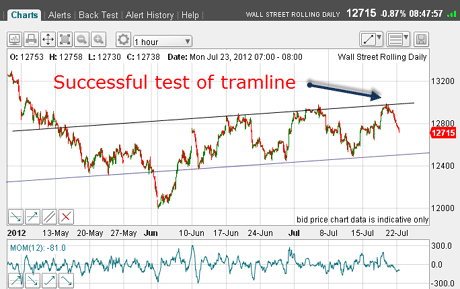
On Friday, I showed my tramlines were operating with a successful test of my upper major tramline.
This is the picture as I write:

(Click on the chart for a larger version)
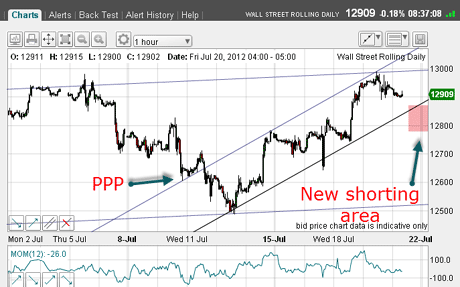
As I showed on Friday, the Thursday rally high at the 13,000 level took it right to the upper tramline. And with this rally, I could draw good tramlines off the 4 June low at 12,000.
This was the picture on Friday:

(Click on the chart for a larger version)
I had my secondary short entry zone marked in pink, anticipating a break down through the lower tramline.
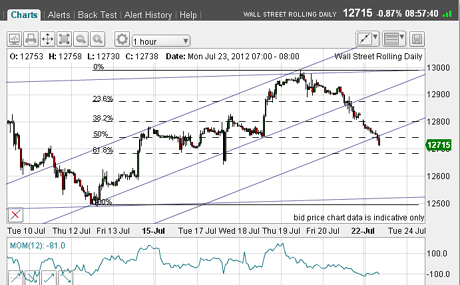
This is the state of play this morning:

(Click on the chart for a larger version)
There was a tramline break on Friday and with that, I could draw in a third, lower tramline as my target.
Shorts have their eyes on Dow 12,500
This morning, the market has sliced through that new tramline like a knife through butter. It's heading for the Fibonacci 62% retrace at sub-12,700.
The market has made a near-300 pip decline off Thursday's high. With the market deeply oversold, if I were a short-term trader, I might have been tempted to take profits here, anticipating a bounce.
The above chart contains a lot of information, and I suggest you study it in detail. In particular, whenever I see a rally running out of steam, I apply my Fibonacci tool right away. This gives me my likely targets.
But just like tramlines, targets are there to be broken! For longer-term traders holding short positions, they may well have their sights set on much lower targets the main one being the 12 July low of 12,500.
Let's see if this is hit soon!
If you have any thoughts, please feel free to share them below.
If you're a new reader, or need a reminder about some of the methods I refer to in my trades, then do have a look at my introductory videos:
The essentials of tramline trading
An introduction to Elliott wave theory
Advanced trading with Elliott waves
Don't miss my next trading insight. To receive all my spread betting blog posts by email, as soon as I've written them, just sign up here .
Get the latest financial news, insights and expert analysis from our award-winning MoneyWeek team, to help you understand what really matters when it comes to your finances.
John is is a British-born lapsed PhD physicist, who previously worked for Nasa on the Mars exploration team. He is a former commodity trading advisor with the US Commodities Futures Trading Commission, and worked in a boutique futures house in California in the 1980s.
He was a partner in one of the first futures newsletter advisory services, based in Washington DC, specialising in pork bellies and currencies. John is primarily a chart-reading trader, having cut his trading teeth in the days before PCs.
As well as his work in the financial world, he has launched, run and sold several 'real' businesses producing 'real' products.
-
 Average UK house price reaches £300,000 for first time, Halifax says
While the average house price has topped £300k, regional disparities still remain, Halifax finds.
-
 Barings Emerging Europe trust bounces back from Russia woes
Barings Emerging Europe trust has added the Middle East and Africa to its mandate, delivering a strong recovery, says Max King