You are now subscribed
Your newsletter sign-up was successful
Want to add more newsletters?

Twice daily
MoneyWeek
Get the latest financial news, insights and expert analysis from our award-winning MoneyWeek team, to help you understand what really matters when it comes to your finances.

Four times a week
Look After My Bills
Sign up to our free money-saving newsletter, filled with the latest news and expert advice to help you find the best tips and deals for managing your bills. Start saving today!
With Halloween just days away, I am wondering what frights the stockmarket will surprise us with. This is, after all, usually the most volatile period of the year. For most of this year, there was little volatility to speak of, and a high degree of complacency set in.
But that all changed on 19 September, when the Dow made its all-time high and then plunged by 1,500 points within days. Since the summer doldrums, the Vix volatility index also known as the fear index' spiked up from the 11 area to a recent high of over 25 a stunning 130% increase. It has fallen back by about 50% since that peak (could this be a buy signal?).
One surprise may be the latest Fed monthly pronouncement, which is being eagerly awaited by the market and will be released later today. The huge recovery off the mid-October plunge lows has been inspired in part by thoughts of a postponement of the Fed's bond-buying taper or even a brand new QE4 programme that could be in the works. There may well be more than the usual emotionally-charged trading around the Fed utterances this time.
MoneyWeek
Subscribe to MoneyWeek today and get your first six magazine issues absolutely FREE

Sign up to Money Morning
Don't miss the latest investment and personal finances news, market analysis, plus money-saving tips with our free twice-daily newsletter
Don't miss the latest investment and personal finances news, market analysis, plus money-saving tips with our free twice-daily newsletter
But today, I want to show how my little foray into Royal Mail shares has progressed, because it illustrates that my tramline methods can be used for timing your share investments, as well as for swing trading.
It is just as important to get your timing right with investments as it is for swing trading. If you can buy a share for 400, why buy it at 550? Most investors pay little attention to timing their trades, and this must adversely impact their performance.
The last piece of the Royal Mail puzzle
I last covered Royal Mail on 20 October and found the latest downtrend was in a lovely complete five-wave pattern and travelled along my tramlines:
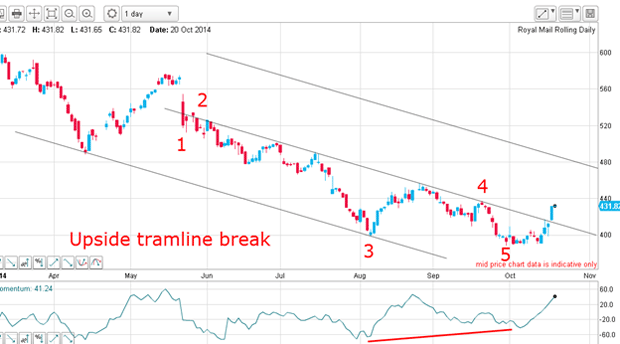
The large positive-momentum divergence was the last piece of this jigsaw, and the fully anticipated upward break of my upper tramline occurred.
The natural trade according to my rules was to go long/cover shorts on that break in the 410 - 20 area. The protective stop could be entered just under the low in the 390 area, or even tighter if you are a more aggressive trader. I advocate using my 3% rule, of course.
This is what I wrote on 20 October: "The market is now challenging the previous w4 high, and a break above this level would place my third tramline as a likely upside target in the 460 - 470 area, depending on how long it would take to get there."
Here we are, nine days later, and did the market make my target in the 460 - 470 area?
Did the market hit the 460 - 470 area?
This is the updated chart:
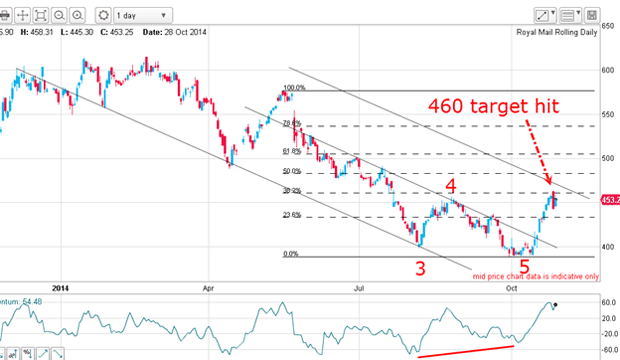
On Monday, the rally carried to 460, the lower end of my target range. That was also the Fibonacci 38% retrace of wave 3 a natural resistance level. And short-term traders could have taken some profits there, of course.
Recall that I set my target range last week based on just this evidence:
- An upward break of my upper tramline
- A complete five wave down move
- A large positive-momentum divergence at the low
All I had to do then was draw my third tramline and put in the Fibonacci levels. It was that easy and done in less than a minute. No complex equations to work out, no reading of screeds of boring market reports on the company (I hate those!), no how do I feel today' wishful thinking or coin tossing, and definitely no acting of tips from the pundits.
There is just one thing wrong from this picture the market fell short of my third tramline. So the question is this: will it go on to hit that target?
Will the market hit my third tramline?
Let's take a closer look:
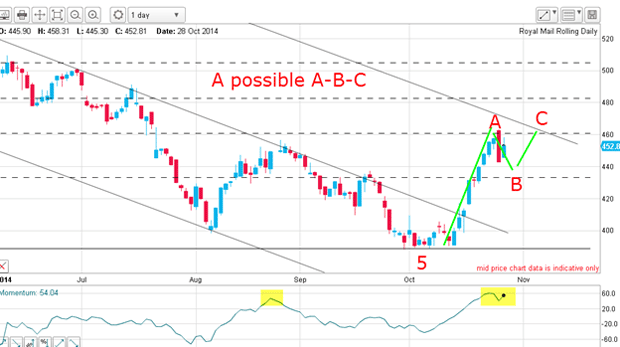
Today, momentum shows a very overbought condition. The last time momentum was this overstretched in August, the market made a high. To me, this suggests the 460 high may be the A wave of an A-B-C pattern.
It is possible the B wave, which we are currently in, could run down to the 430 - 435 area, which is chart support, before moving higher in the C wave. Ideally, the C wave could extend to the Fibonacci 50% or even 62% level before possibly turning around.
But if the market does rally to my third tramline, that opens up several options. For instance, the market could break up above it and run on to the Fibonacci 50% or 62% levels. Or it could be repelled by it and resume the downtrend.
But I have a rough roadmap largely provided by basic Elliot wave theory and Fibonacci and I will let the market do its work and then interpret what I see from this action as traced out on the charts. It is really a simple process once you let go of any desire to force the market your way.
-
 MoneyWeek Talks: The funds to choose in 2026
Podcast Fidelity's Tom Stevenson reveals his top three funds for 2026 for your ISA or self-invested personal pension
-
 Three companies with deep economic moats to buy now
Opinion An economic moat can underpin a company's future returns. Here, Imran Sattar, portfolio manager at Edinburgh Investment Trust, selects three stocks to buy now

