My forecast was correct: gold is glistening again
Gold is trading higher once more. John C Burford draws on Elliott wave theory to set his entries and exits with pinpoint accuracy.
Get the latest financial news, insights and expert analysis from our award-winning MoneyWeek team, to help you understand what really matters when it comes to your finances.
You are now subscribed
Your newsletter sign-up was successful
Want to add more newsletters?

Twice daily
MoneyWeek
Get the latest financial news, insights and expert analysis from our award-winning MoneyWeek team, to help you understand what really matters when it comes to your finances.

Four times a week
Look After My Bills
Sign up to our free money-saving newsletter, filled with the latest news and expert advice to help you find the best tips and deals for managing your bills. Start saving today!
Today, with the help of my gold forecast from last Wednesday, I wish to show how even a basic understanding of Elliott wave theory can boost your trading performance and help you spot high-probability trend changes.
Too many traders hang on far too long to winning positions well after a change of trend. They see their profits evaporate and even turn into losses.
This is not a fate I wish for you!
MoneyWeek
Subscribe to MoneyWeek today and get your first six magazine issues absolutely FREE

Sign up to Money Morning
Don't miss the latest investment and personal finances news, market analysis, plus money-saving tips with our free twice-daily newsletter
Don't miss the latest investment and personal finances news, market analysis, plus money-saving tips with our free twice-daily newsletter
That is why Elliott wave theory can pinpoint these trade entry and exit points, sometimes with high precision, as it has in the gold charts.
My best guess for gold
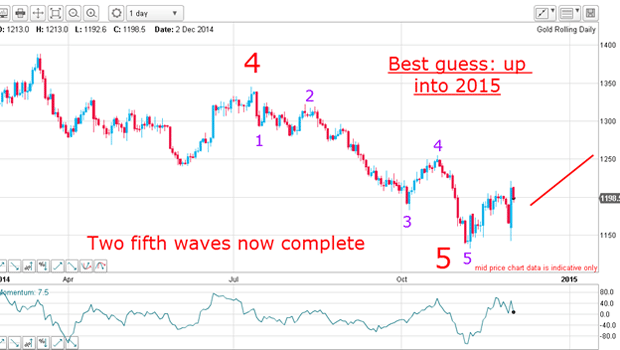
The plunge low to the $1,130 area was the final blow-off as two fifth waves completed. When you see two fifth waves, get ready for a turn-around, which could be very sharp, depending on the sentiment picture.
And the bullish sentiment was on the floor with the DSI (daily sentiment index) bullish reading at only 4% and that meant only one thing: when the rally got under steam, the short squeeze would be well and truly on and prices would rocket up.
My short-term scenario was this:
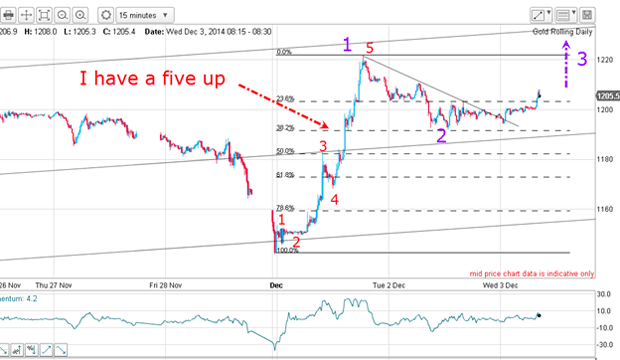
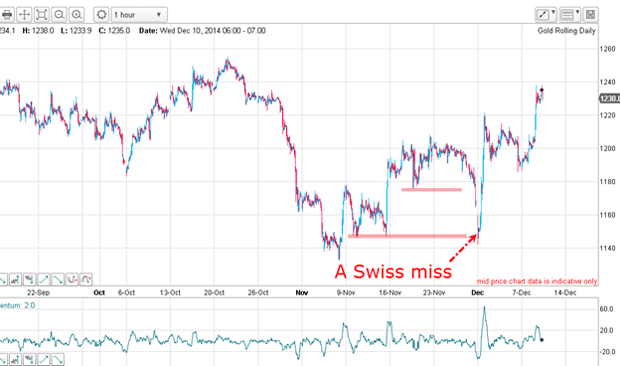
Remember, the Swiss referendum vote result was out and the market sold off heavily. The resulting rally had a pretty five-wave motive pattern on the 15-minute indicating the trend had changed to up. Trading from the long side was the correct policy, and my first major target was the $1,250 area.
A Swiss miss in the gold charts
But now I have a clear Elliott wave pattern on the daily as my best guess scenario:
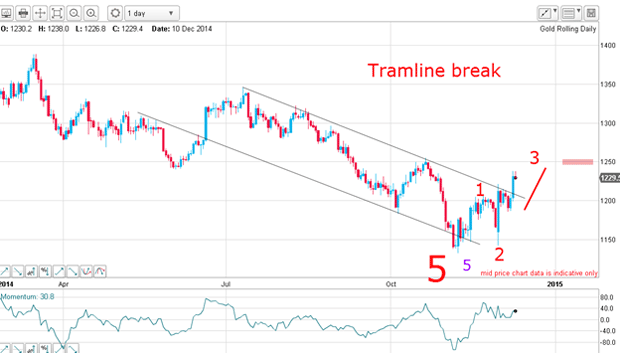
The first rally to the $1,200 area is my w1. The Swiss miss is my w2 down and we are currently in w3 up.
Identifying the current w3 was pretty easy: the moves are very strong in the upward direction and short in the downward direction. Remember, third waves are always strong and often very long.
This is what I wrote last Wednesday: "If correct, the market is in the early stages of a large third wave up. To confirm this, I need to see a rapid rise towards my upper tramline and beyond to the last major high at the $1,250 area."
Now I have a clear tramline pair and yesterday, the market powered past the upper tramline to confirm the bullish break.
We could see a pull-back for a kiss on that line, but it is certainly not required.
The market is currently within $10 of my first target.
Where can I take short-term profits?
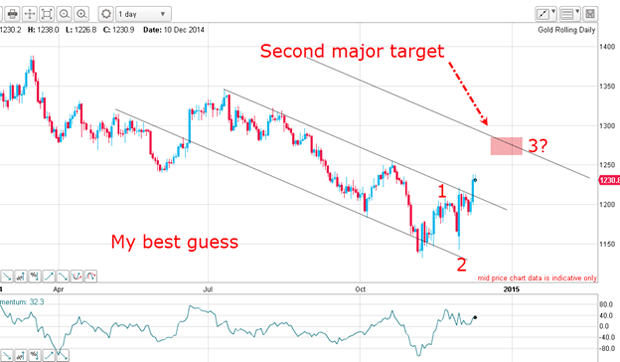
I have now drawn in my third upper tramline and that now becomes my second major target. Naturally, if the market can spurt up quickly, it will reach my tramline at a higher level than if it takes its time to get there.
With a basic knowledge of Elliott wave theoryand my very simple tramline method, I have followed the twists and turns almost to the pip.
Get the latest financial news, insights and expert analysis from our award-winning MoneyWeek team, to help you understand what really matters when it comes to your finances.
John is is a British-born lapsed PhD physicist, who previously worked for Nasa on the Mars exploration team. He is a former commodity trading advisor with the US Commodities Futures Trading Commission, and worked in a boutique futures house in California in the 1980s.
He was a partner in one of the first futures newsletter advisory services, based in Washington DC, specialising in pork bellies and currencies. John is primarily a chart-reading trader, having cut his trading teeth in the days before PCs.
As well as his work in the financial world, he has launched, run and sold several 'real' businesses producing 'real' products.
-
 ISA fund and trust picks for every type of investor – which could work for you?
Whether you’re an ISA investor seeking reliable returns, looking to add a bit more risk to your portfolio or are new to investing, MoneyWeek asked the experts for funds and investment trusts you could consider in 2026
-
 The most popular fund sectors of 2025 as investor outflows continue
It was another difficult year for fund inflows but there are signs that investors are returning to the financial markets