Looking for clues to find gold's top
Gold is at a pivotal stage. Will it head even higher or pull back from a potential 'double top'? John C Burford looks for evidence in the charts.
Get the latest financial news, insights and expert analysis from our award-winning MoneyWeek team, to help you understand what really matters when it comes to your finances.
You are now subscribed
Your newsletter sign-up was successful
Want to add more newsletters?

Twice daily
MoneyWeek
Get the latest financial news, insights and expert analysis from our award-winning MoneyWeek team, to help you understand what really matters when it comes to your finances.

Four times a week
Look After My Bills
Sign up to our free money-saving newsletter, filled with the latest news and expert advice to help you find the best tips and deals for managing your bills. Start saving today!
Gold is in a position that is shaping up to be pivotal.
When I last wrote on the subject, I showed how I was able to forecast the $1,912 top, and then take a very large profit from the short side.
My opinion back then was for gold to rally from my lower tramline in the $1,730 area, and then resume the downtrend.
MoneyWeek
Subscribe to MoneyWeek today and get your first six magazine issues absolutely FREE

Sign up to Money Morning
Don't miss the latest investment and personal finances news, market analysis, plus money-saving tips with our free twice-daily newsletter
Don't miss the latest investment and personal finances news, market analysis, plus money-saving tips with our free twice-daily newsletter
As we all know, that didn't happen. Gold staged a stronger rally than I had originally thought and moved up to the $1,920 level last Tuesday.
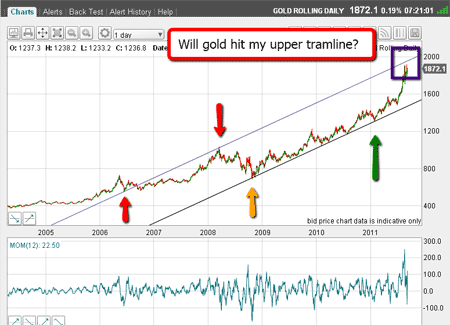
But before I continue the story, let's step back and examine the long-term picture. Here is the daily chart going back to 2005:

(Click on the chart for a larger version)
For my upper tramline, I have used the significant points marked by the two red arrows. The first one is very significant to see why, watch my tutorial video: The essentials of tramline trading.
For my lower tramline, there are several excellent touch points between the yellow and green arrows.
That is a very impressive pair of tramlines, and one with high reliability. If the market rallies to the upper tramline, we can expect significant resistance.
OK, with the market around $1,900, it is getting very close to the upper tramline, currently around $1,950. We are only $70 or so away.
Have we seen a 'double top' in gold?
The big question is: will it rise to touch it? Let's have a look at the evidence.
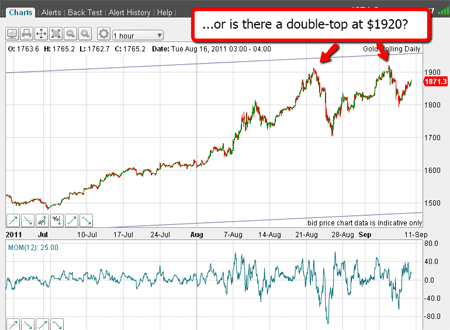
Here is the hourly chart:

(Click on the chart for a larger version)
Already, we can see that the market is getting close to the upper tramline.
But there is a potential double-top in the $1,920 area. That bears watching.
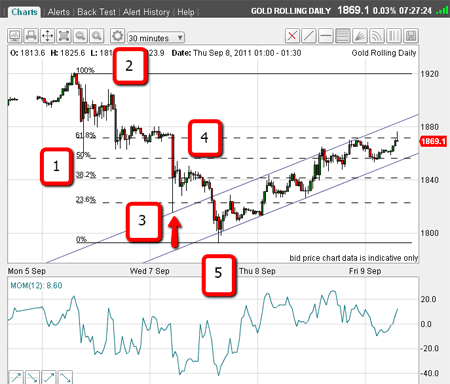
Let's zero in on the decline from the most recent high. If I can spot a five-wave pattern, that could well increase the odds for the $1,920 high being the top.

(Click on the chart for a larger version)
On this 30-minute chart, there is a clear five-wave move down to the recent $1,790 low. So far, so good.
As we know from our Elliott wave theory (see my video tutorial: An introduction to Elliott wave theory), a fifth wave is an ending wave.
Then, we can expect a rally, and that is exactly what we are getting.
I have drawn in the Fibonacci retracement levels, which I always do to find possible turning points. The market is currently trading around the 62% retrace.
This may be a turning point, but I need more evidence.
Plan A and plan B: two bites at the cherry
And to give me that evidence, I have drawn a nice pair of tramlines.
The upper tramline passes right through the wave 3 low and then across the tops. This is an excellent line.
The lower tramline passes through the important lows. All trading off the low is contained within the channel. Moving out of the channel will be a significant development.
The market is pushing towards the upper tramline as I write. Now, this is a typically crucial stage in this possible counter-trend rally.
I will be looking to short the market if it reaches my upper tramline, using my 3% rule for protection. That is my plan A.
But of course, the market may not reach it. So what to do?
I have a plan B. And that is to set entry sell-stops just below the lower tramline.
Of course, this is a potentially riskier trade, as the market can rally in a head fake (this does happen!). This would entail being short at the $1,860 area with a stop above $1,885 for a $25+ risk.
So I have two upper targets. The first is my upper tramline on the short-term chart at $1,890 area. The second is the long-term tramline at $1,950 or so.
I have a feeling at least one of them will be hit. We shall see.
Just a note: if you are considering a similar trade yourself (or any other for that matter), always remember the most important thing is risk management. Ensure you have stop losses in place. The key to successful trading is not to get every trade right (that's impossible), but to minimise your losses on the losing trades, and maximise your profits on the trades that do work out.
Don't miss my next trading insight. To receive all my spread betting blog posts by email, as soon as I've written them, just sign up here .
Get the latest financial news, insights and expert analysis from our award-winning MoneyWeek team, to help you understand what really matters when it comes to your finances.
John is is a British-born lapsed PhD physicist, who previously worked for Nasa on the Mars exploration team. He is a former commodity trading advisor with the US Commodities Futures Trading Commission, and worked in a boutique futures house in California in the 1980s.
He was a partner in one of the first futures newsletter advisory services, based in Washington DC, specialising in pork bellies and currencies. John is primarily a chart-reading trader, having cut his trading teeth in the days before PCs.
As well as his work in the financial world, he has launched, run and sold several 'real' businesses producing 'real' products.
-
 Average UK house price reaches £300,000 for first time, Halifax says
While the average house price has topped £300k, regional disparities still remain, Halifax finds.
-
 Barings Emerging Europe trust bounces back from Russia woes
Barings Emerging Europe trust has added the Middle East and Africa to its mandate, delivering a strong recovery, says Max King