You are now subscribed
Your newsletter sign-up was successful
Want to add more newsletters?

Twice daily
MoneyWeek
Get the latest financial news, insights and expert analysis from our award-winning MoneyWeek team, to help you understand what really matters when it comes to your finances.

Four times a week
Look After My Bills
Sign up to our free money-saving newsletter, filled with the latest news and expert advice to help you find the best tips and deals for managing your bills. Start saving today!
Today I want to follow up on the FTSE story from Wednesday because it shows how you can use my tramlinemethods to extract profits. Remember, the tramline method is a very simple one and requires only one screen, not the huge array that many traders seem to need nowadays.
You can get an idea of how complicated trading has become if you watch the BBC series Traders: Millions by the Minute. The programme this week followed several novice traders as they grappled with trying to fit in the making of millions with their everyday lives.
Suddenly, it seems that trading is cool. Of course, the programme is primarily entertainment with little informative value, but I couldn't help noticing that the current trend, encouraged by the trading courses, is to have multiple screens on your trading desk. Some have an array of six screens looking much like the huge solar panels on a spacecraft.
MoneyWeek
Subscribe to MoneyWeek today and get your first six magazine issues absolutely FREE

Sign up to Money Morning
Don't miss the latest investment and personal finances news, market analysis, plus money-saving tips with our free twice-daily newsletter
Don't miss the latest investment and personal finances news, market analysis, plus money-saving tips with our free twice-daily newsletter
These screens display a whole raft of technical indicators working on multiple markets in real time in full technicolour.
As you can gather, that is not my style. The temptation with beginners is to assume the more technology you can buy, the faster will be your journey to those millions. For some, maybe that is the case. But for most, that is trying to run before you can walk.
I designed my single-screen method specifically to avoid over-complication, which is the enemy of understanding. Of course, once you have mastered the tramline system, you can build on that knowledge base if you wish.
I firmly maintain that to make progress as a trader, you do not need to understand the trading systems so much as to gain a greater understanding of yourself and this is independent of any system and screen setup you use. One of the most important psychological imperatives is how do you handle a losing trade and a series of losers.
Did we get our rally?
Let's get back to the FTSE story. On Wednesday, I noted that the plunge had taken the FTSE down to a tramline support. This was the picture then:
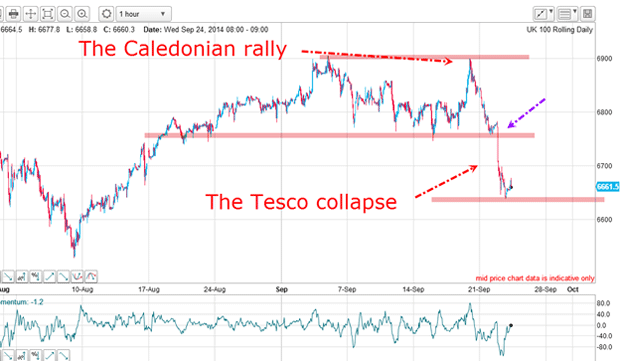
So did we get a rally off the lower pink zone? Here is the hourly chart as of yesterday:

The decline is in a clear five waves with a long and strong wave 3. And as the market was making the wave 5 low, a large positive momentum divergencewas opening up and this was a solid clue that the selling was drying up rally ahoy!
Note that I have already applied my Fibonacci levels in anticipation of a possible turn at one of the levels.
Naturally, that was the signal to take some profits on short-term trades. If a short trade was initiated on the break of the centre pink zone, a profit of around 100 points could have been secured in just a few hours. The hourly FTSE chart with the momentum indicator was all that was required to nail this profit.
But that centre zone break means that it now becomes resistance. As I write, the rally has not yet carried to that zone.
In fact, it may not, because as I write early Thursday afternoon, I have spotted a possible A-B-Cand if the market declines from here, we are very likely in a third wave down.
Here's what you can do with my trading rules
The question now is this: will we see a clear three waves up in an A-B-C?
Let's look at the finer detail:

Here are my tentative tramlines. They are only pencilled in because I have too few touch points to consider them secure. But at least I have nice PPPs (prior pivot points)on my lower line.
Note that the rally hasn't yet made it to the Fibonacci 38% level. Remember that the 50% level is where my centre pink zone lies and major resistance. So they remain valid upper targets.
Naturally, if only one of them is hit, that would mean a break of my upper tramline.
So now, I have taken partial profits on my trade and moved my protective stop to the other half in the 6,770 region at break even, following my break even rule.
This is my recommended standard practice, of course. And it means that my worst case scenario is to be taken out at break even and leave the banked profit on the first half of 100 points.
To achieve this result, I did not need a professional dealing room with acres of screens that looks impressive on TV. All I needed was a simple application of my trading rules, which I believe anyone can master. Incidentally, that was why I decided to create the Trade for Profit Academy. We now have hundreds of active members that are each moving their trading skills up level by level.
-
 Average UK house price reaches £300,000 for first time, Halifax says
While the average house price has topped £300k, regional disparities still remain, Halifax finds.
-
 Barings Emerging Europe trust bounces back from Russia woes
Barings Emerging Europe trust has added the Middle East and Africa to its mandate, delivering a strong recovery, says Max King

