Is gold heading for a reversal?
The price of gold is powering on past $1,600 an ounce, and traders have become ever more bullish. But John C Burford isn't so sure. Looking at the charts, he says, there is strong evidence that the gold market is nearing a top, and a correction is due.
Get the latest financial news, insights and expert analysis from our award-winning MoneyWeek team, to help you understand what really matters when it comes to your finances.
You are now subscribed
Your newsletter sign-up was successful
Want to add more newsletters?

Twice daily
MoneyWeek
Get the latest financial news, insights and expert analysis from our award-winning MoneyWeek team, to help you understand what really matters when it comes to your finances.

Four times a week
Look After My Bills
Sign up to our free money-saving newsletter, filled with the latest news and expert advice to help you find the best tips and deals for managing your bills. Start saving today!
A very important point has been reached in the long-range gold charts.
When I last left gold on 4 July: What's next for gold? the market was coming off the highs and tramlines were being broken. It appeared that gold was heading down, at least in the short term.
But right after my email, the market caught a bid and is powering up to make new highs in the $1,620 area.
MoneyWeek
Subscribe to MoneyWeek today and get your first six magazine issues absolutely FREE

Sign up to Money Morning
Don't miss the latest investment and personal finances news, market analysis, plus money-saving tips with our free twice-daily newsletter
Don't miss the latest investment and personal finances news, market analysis, plus money-saving tips with our free twice-daily newsletter
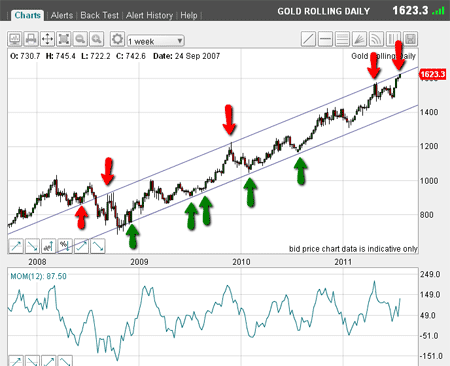
This area is a critical one, and I will show you why on the very long-range weekly chart:

(Click on the chart for a larger version)
The first tramline I drew was the upper one. I anchored it on the low of August 2007 and found that several important highs lay on this line (marked by red arrows).
This is a four-year-old tramline, please note.
Then, I took my parallel line generator on my spread betting platform and found that the significant lows in the 2009-2010 period lay right on my lower tramline (marked by green arrows).
I consider these tramlines to be extremely reliable.
Now, old tramline patterns can and do break down eventually. We cannot forecast when this will happen. All we can do is go with what we have and wait for the market to tell us it has changed its mind.
Two points here. First, since the low of July 2010 in the $1,180 area, the market has not come close to touching the lower tramline.
That tells me that traders have become over-exuberant in the past year. I will come back to this point later.
The second point is that the market currently is trading bang up against my upper tramline.
Of course, with my rather crude drawing methods over a four-year time frame, we must allow a certain tolerance in tramline placement.
I would give that tolerance about $10 plus or minus here.
So, according to my tramline trading methods, we would be looking to sell our long positions and reversing to the short side.
So much for the big picture here's what's going on right now
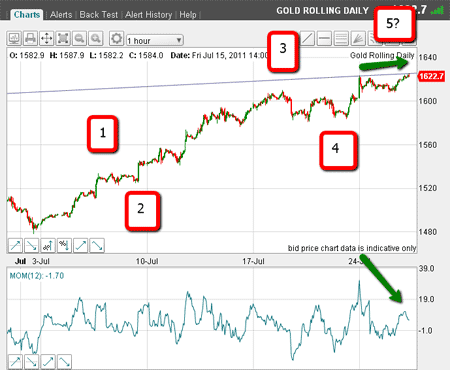
But we need to see what is going on in the short-term, so let's go to our hourly chart:

(Click on the chart for a larger version)
I have shown the important low of late June, leading to the current rally.
I can count five waves up with all of the correct guidelines in place, such as wave 3 being the longest and strongest, and a complex wave 4, leading to a wave 5 on reduced momentum giving a potential negative momentum divergence (marked by green arrows).
According to Elliott, a complete five-wave sequence is a reversal signal.
The sloping line is my four-year-old upper tramline. The market rallied to it on Monday, bounced off, and is now testing it again as I write.
The market seems to agree that this line is of critical importance.
If it remains a solid line of resistance, the market will fall from here after, at most, a brief overshoot.
If the market pushes through strongly, then we are off to the races and the rally is intact.
Depsite the bullishness, the evidence of a top is strong
But what are the gold traders actually doing?
As you know, we can get an insight into this from the Commitments of Traders reports issued by the futures exchanges and the US government.
In my 4 July post, I gave the figures as of 28 June, and the changes since then are very illuminating here is the latest data as of 19 July:
| Hedge funds | 277,000 | 58,000 | 226,000 | 60,000 |
| Change in past week | +15,000 | -7,000 | Row 1 - Cell 3 | Row 1 - Cell 4 |
| Row 2 - Cell 0 | +5% | -12% | Row 2 - Cell 3 | Row 2 - Cell 4 |
Net swing to bull is +17%
So, since the 1 July $1,480 low (about four weeks ago), the large hedge funds have become super-bullish, increasing their long bets by 51,000 contracts (a whopping +22%).
Meanwhile, the shorts have been throwing in the towel, reducing their positions by a massive 12% in the past week.
So, in the past week alone, there has been a swing to the bull camp of about +17%.
In other words, the hedgies (the largest participants) are making the classic error of becoming solidly more bullish as the market rallies.
Recall my point above about the out-of-control nature of the weekly chart in the past year? Even the hedge funds herd!
Wouldn't it be a terrific validation of my weekly tramlines if we are indeed seeing the top in gold here?
If the market can break support at the $1,608 area, that would strengthen the bearish case.
Of course, time will tell, but from where I sit, the evidence is strong that a top is near. To my eye, we are seeing a very crowded trade and I expect a big correction at some point.
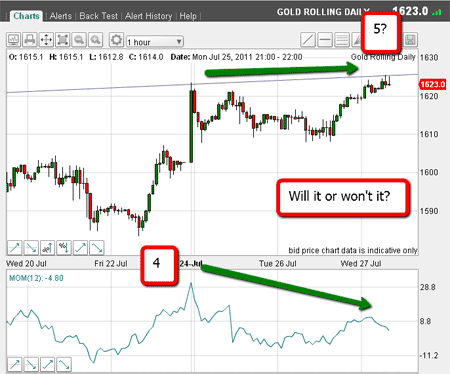
I thought I would sign off with the current hourly chart in close-up showing the resistance at the tramline and the potential huge negative momentum divergence at the current $1,625 high:

(Click on the chart for a larger version)
Don't miss my next trading insight. To receive all my spread betting blog posts by email, as soon as I've written them, just sign up here .
Get the latest financial news, insights and expert analysis from our award-winning MoneyWeek team, to help you understand what really matters when it comes to your finances.
John is is a British-born lapsed PhD physicist, who previously worked for Nasa on the Mars exploration team. He is a former commodity trading advisor with the US Commodities Futures Trading Commission, and worked in a boutique futures house in California in the 1980s.
He was a partner in one of the first futures newsletter advisory services, based in Washington DC, specialising in pork bellies and currencies. John is primarily a chart-reading trader, having cut his trading teeth in the days before PCs.
As well as his work in the financial world, he has launched, run and sold several 'real' businesses producing 'real' products.
-
 Average UK house price reaches £300,000 for first time, Halifax says
While the average house price has topped £300k, regional disparities still remain, Halifax finds.
-
 Barings Emerging Europe trust bounces back from Russia woes
Barings Emerging Europe trust has added the Middle East and Africa to its mandate, delivering a strong recovery, says Max King