How I'm playing the bond bubble
From governments to individuals, everyone has been piling on the debt. John C Burford reveals how he's playing the bond bubble.
Get the latest financial news, insights and expert analysis from our award-winning MoneyWeek team, to help you understand what really matters when it comes to your finances.
You are now subscribed
Your newsletter sign-up was successful
Want to add more newsletters?

Twice daily
MoneyWeek
Get the latest financial news, insights and expert analysis from our award-winning MoneyWeek team, to help you understand what really matters when it comes to your finances.

Four times a week
Look After My Bills
Sign up to our free money-saving newsletter, filled with the latest news and expert advice to help you find the best tips and deals for managing your bills. Start saving today!
Governments, corporations and private individuals alike have been piling on debt in recent years, spurred on by record low interest rates and a desire to spend the proceeds. In fact, total global debt today is 40% higher than it was in 2007 just before the credit crunch collapse in asset markets.
That is why there has been talk of a bond bubble developing. Today, I want to show how I have been playing it.
Central banks and corporations have broken the bond market
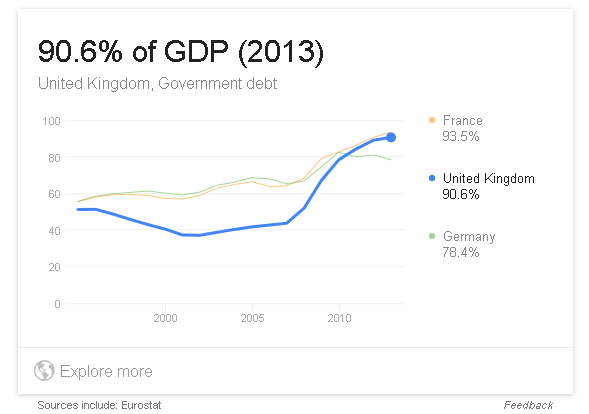
The UK debt-to-GDP ratio has more than doubled in only ten years and is still growing. It is a similar story for other advanced nations (and worse for many developing nations). But despite that, interest rates have been pushed to the floor in an apparent failure of the law of supply and demand.
MoneyWeek
Subscribe to MoneyWeek today and get your first six magazine issues absolutely FREE

Sign up to Money Morning
Don't miss the latest investment and personal finances news, market analysis, plus money-saving tips with our free twice-daily newsletter
Don't miss the latest investment and personal finances news, market analysis, plus money-saving tips with our free twice-daily newsletter
Of course, one major reason for this apparent failure has been the immense bond-buying power of the central banks. Those banks have been mopping up sovereign debt in their quantitative easing (QE) operations, attempting to stimulate' economies following the 2008 credit crunch.
Central banks have been the largest buyers of bonds, and are totally price-insensitive. That has allowed the canny banks and hedge funds to front-run' them by pushing many bond yields into unprecedented negative territory.
This one-way bet became more and more extreme. Now, over €2trn of eurozone debt is at negative yield a position that was unthinkable until recently.
Over in the USA, corporations have also been on a debt binge:
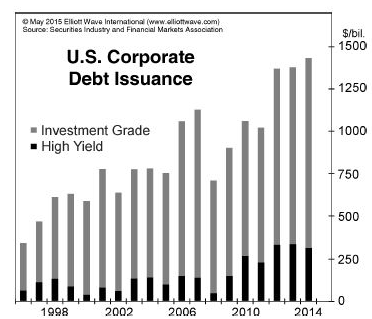
Note the huge build-up of junk (high yield) debt over the past few years. Much of this is what is termed covenant-lite', which means that there is ample scope for the debtor to change the payment terms and collateral at will and even suspend payments if it wishes.
Buyers of this low-quality debt which now comprises an estimated 60% of all high-yield debt are extremely vulnerable to default, especially if interest rates suddenly lurch upward.
Debt is everywhere and credit managers are terrified
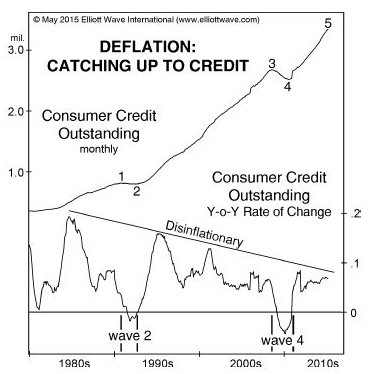
Much of high-yield debt rests on the backs of the US consumer, already suffering from low wage growth. Even a slight increase in interest rates would have a major impact on default rates.
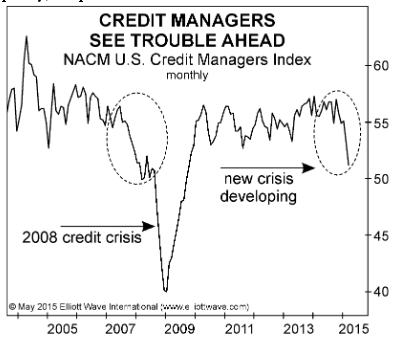
The debt situation has become so worrying that even the credit professionals are concerned. Here is an index showing how concerned they are:
Above charts courtesy www.elliottwave.com
This looks suspiciously like the repeat of the credit crunch of 2008.
This bond bubble has been building for some time, and bond prices have generally been trending upwards.
Something has to give sometime, just as it did in 2008. Back then, my task was to try to identify when the house of debt cards would start to topple over. I believed big profits awaited.
A swing trader can't just jump in and close his eyes, hoping the market will read his mind. Trade timing is absolutely critical. That is why I developed my tramline system for putting the odds on your side and I will show how I identified an excellent low-risk trade .
How I played the bond bubble
The primary reason I liked the T-Bonds here is that US interest rates determine global rates. When the US Treasury sneezes, UK gilts and German bunds catch a virus.
The market had rallied to a high on 25 May, but on a huge momentum divergence. That was a warning that the rally was probably on its last legs as buying power was waning and selling was in the ascendant.
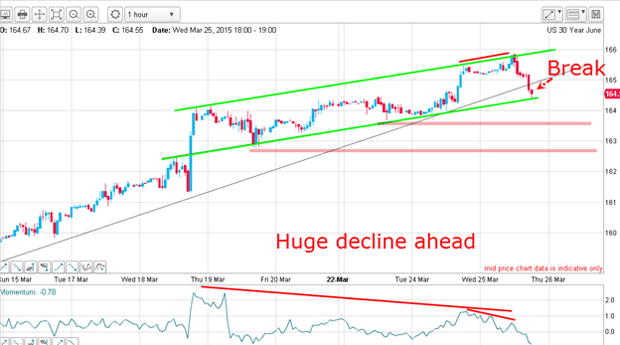
The market had been following the black trendline, and I was also able to draw a nice short-term tramline pair (green lines). I noted that the market had just broken the long term trendline and was challenging the lower green tramline.
Breaking that could spell the end of the rally but this market has a habit of taking its time in rolling over.
If we fast forward to today, we can see that the market did indeed have more work to do at the highs. After much churning, the market made a clear wedge pattern, breaking the lower wedge line on 22 April:
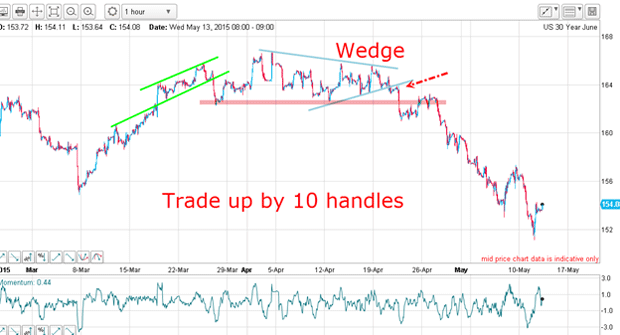
That was an excellent place to enter a short trade with low risk.
Since then, the market has collapsed by over ten handles (the term handle' is used for the big number before the decimal point). A short trade taken at the 164 area would see you up by 1,000 pips. Nice.
Naturally, this bond collapse has suddenly been noticed by the media with the term bond rout' being widely quoted. That apocalyptic language is a signal for the market to reverse back upwards, trapping the late-comers who trade off the media.
But to rack up these profits, you had to have seen what others failed to see in April. Back then, bullish sentiment prevailed. But a swing trader uses this information to base a contrary position, as I did here.
There is little doubt that much damage has been done to the bond markets T-Bond yields are up by 40% since the January low with a huge impact on the future interest payments of heavily indebted governments UK included.
The race to deleverage has started!
Get the latest financial news, insights and expert analysis from our award-winning MoneyWeek team, to help you understand what really matters when it comes to your finances.
John is is a British-born lapsed PhD physicist, who previously worked for Nasa on the Mars exploration team. He is a former commodity trading advisor with the US Commodities Futures Trading Commission, and worked in a boutique futures house in California in the 1980s.
He was a partner in one of the first futures newsletter advisory services, based in Washington DC, specialising in pork bellies and currencies. John is primarily a chart-reading trader, having cut his trading teeth in the days before PCs.
As well as his work in the financial world, he has launched, run and sold several 'real' businesses producing 'real' products.
-
 ISA fund and trust picks for every type of investor – which could work for you?
Whether you’re an ISA investor seeking reliable returns, looking to add a bit more risk to your portfolio or are new to investing, MoneyWeek asked the experts for funds and investment trusts you could consider in 2026
-
 The most popular fund sectors of 2025 as investor outflows continue
It was another difficult year for fund inflows but there are signs that investors are returning to the financial markets