FTSE 100 – seven years of plenty; now seven years of famine?
Will the stockmarket build on the gains from the general election? John C Burford examines the charts for clues.
Get the latest financial news, insights and expert analysis from our award-winning MoneyWeek team, to help you understand what really matters when it comes to your finances.
You are now subscribed
Your newsletter sign-up was successful
Want to add more newsletters?

Twice daily
MoneyWeek
Get the latest financial news, insights and expert analysis from our award-winning MoneyWeek team, to help you understand what really matters when it comes to your finances.

Four times a week
Look After My Bills
Sign up to our free money-saving newsletter, filled with the latest news and expert advice to help you find the best tips and deals for managing your bills. Start saving today!
With the UK election results still ringing in our ears, I thought I would go a little off-piste today and offer my take on the FTSE, which rallied strongly on Friday. This reaction was entirely normal because many had forecast a hung parliament and had placed bets that the FTSE would decline if Labour won.
Needless to say, when a result is unexpected', markets will react sharply the wrong' way.
So we must ascribe much of Friday's gains to short covering, but the big question is: will the market build on these gains? I will look at the technical picture today to try to answer that.
MoneyWeek
Subscribe to MoneyWeek today and get your first six magazine issues absolutely FREE

Sign up to Money Morning
Don't miss the latest investment and personal finances news, market analysis, plus money-saving tips with our free twice-daily newsletter
Don't miss the latest investment and personal finances news, market analysis, plus money-saving tips with our free twice-daily newsletter
Incidentally, most of the political pundits got it all wrong. They had predicted a close race with a hung parliament the likely outcome. But the surprise' result is totally understandable from the perspective of social mood. Big social events like this are directed by social mood which is currently very positive, as reflected by the bullish stockmarkets.
If stocks were in a bear trend, the depressed public would have thrown the bums out. Bull markets tend to favour the incumbents, and vice versa.
So far, all the Tory win has delivered is a jump in sterling surely, not a formula to boost exports (or share prices), which is the prime motivation behind governments all over the globe. This desire to encourage exports is why we are seeing a race to the bottom' in the currencies.
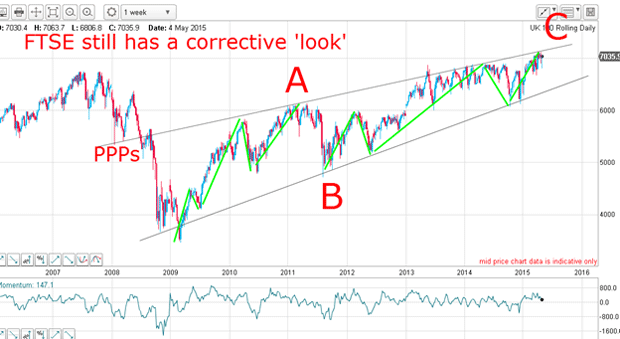
My FTSE wedge is perfect all the way back to 2007

Remember, rising wedges usually resolve to the downside.
Both waves A and C contain five-wave motive patterns (in green) that contain strong third waves. This is entirely typical.
So let me take a closer look at this wedge. The lower line has many accurate touch points and one overshoot at the start, but I always allow one such overshoot in such a line stretching over many years. Frankly, it is still astonishing that straight lines can hold lows and highs after such a long time. For example, the December 2014 low was held precisely by this seven-year-old line of support.
Basically, if you can draw a straight line, you have a trading method! And if you can count up to five, you can master basic Elliott wave theory.
The upper line sports several accurate touch points as well as two beautiful prior pivot points (PPP). There is one overshoot in 2013.
I consider this wedge the most important chart formation in the long term FTSE index and the wedge lines remain solid lines of support (lower) and resistance (upper).
A closer look at the FTSE and another strong wedge

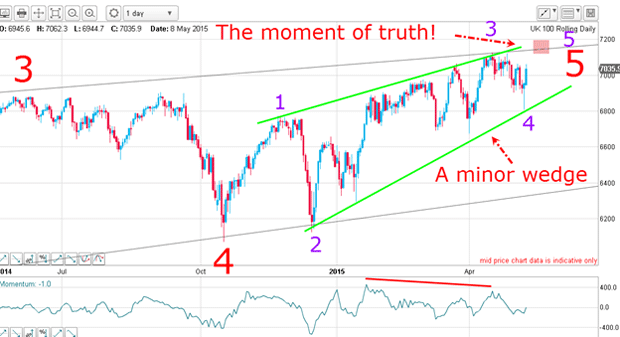
What's more, the green lines describing this wedge are pretty solid. The upper line (resistance) has multiple accurate touch points with no overshoots. The lower line (support) contains the four major spike lows very accurately.
This is astonishing: I now have two wedge patterns on two different time scales. But what is even more astonishing is that the two upper wedge lines have crossed over . When two lines of solid resistance cross, that represents major resistance.
Note that the heavy resistance at the cross-over was my purple wave 3 high which lead to the sharp decline in wave 4.
So now I have a maximum target for purple wave 5 and large red wave 5 and the entire ending of huge wave C.
If the market can push strongly above the purple region (my moment of truth), that would set the market up for further gains. But achieving that will not be easy. A failure here would set the highs in place and selling would drive the market towards the lower green wedge line.
Breaking that line would almost certainly encourage further selling and then the lower wedge line in the 6,400 region would become a target.
This is my bottom line: the FTSE is entering a critical stage. Using my tramlime method, I have a clear upside target for a top. A failure here would herald a rapid decline.
Get the latest financial news, insights and expert analysis from our award-winning MoneyWeek team, to help you understand what really matters when it comes to your finances.
John is is a British-born lapsed PhD physicist, who previously worked for Nasa on the Mars exploration team. He is a former commodity trading advisor with the US Commodities Futures Trading Commission, and worked in a boutique futures house in California in the 1980s.
He was a partner in one of the first futures newsletter advisory services, based in Washington DC, specialising in pork bellies and currencies. John is primarily a chart-reading trader, having cut his trading teeth in the days before PCs.
As well as his work in the financial world, he has launched, run and sold several 'real' businesses producing 'real' products.
-
 ISA fund and trust picks for every type of investor – which could work for you?
Whether you’re an ISA investor seeking reliable returns, looking to add a bit more risk to your portfolio or are new to investing, MoneyWeek asked the experts for funds and investment trusts you could consider in 2026
-
 The most popular fund sectors of 2025 as investor outflows continue
It was another difficult year for fund inflows but there are signs that investors are returning to the financial markets