The FTSE 100 is like a coiled spring
The FTSE 100 is poised for a big move - the bulls are getting worried, and the bears are feeling bolder. John C Burford looks to the charts to see which way the market might turn.
Get the latest financial news, insights and expert analysis from our award-winning MoneyWeek team, to help you understand what really matters when it comes to your finances.
You are now subscribed
Your newsletter sign-up was successful
Want to add more newsletters?

Twice daily
MoneyWeek
Get the latest financial news, insights and expert analysis from our award-winning MoneyWeek team, to help you understand what really matters when it comes to your finances.

Four times a week
Look After My Bills
Sign up to our free money-saving newsletter, filled with the latest news and expert advice to help you find the best tips and deals for managing your bills. Start saving today!
Swing traders are accustomed to poring over hourly, 15-minute, and daily charts. That is because we are attempting to take advantage of moves that last hours and days before the swing reverses and reduces our gains.
But an occasional reading of the weekly charts should also be part of every trader's routine.
Long-range charts can highlight the long-term trend and important turning points that occurred in the past. And as we all know, markets have excellent memories.
MoneyWeek
Subscribe to MoneyWeek today and get your first six magazine issues absolutely FREE

Sign up to Money Morning
Don't miss the latest investment and personal finances news, market analysis, plus money-saving tips with our free twice-daily newsletter
Don't miss the latest investment and personal finances news, market analysis, plus money-saving tips with our free twice-daily newsletter
The chart below shows the FTSE a market I do monitor, but trade far less often than the Dow. Maybe that is because it is generally the Dow that makes the best Elliott waves, the best tramlines, and the best Fibonacci retraces of the major stock indexes, in my experience.
At times, of course, other indexes offer better charts than the Dow. That is why I still keep an eye on the FTSE, and the long-term charts are revealing.
Here is the weekly chart going back to before 2007:
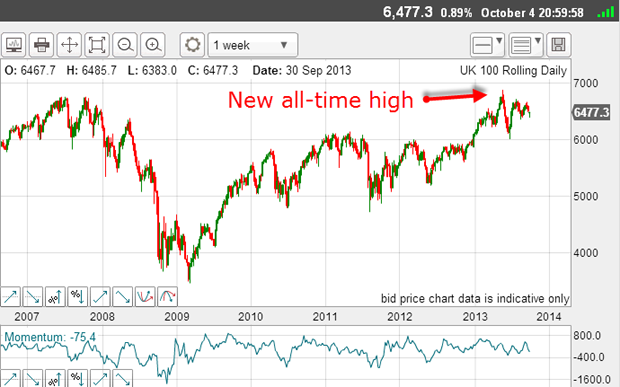
The huge rally off the 3,500 low in early 2009 to the all-time high of 6,870 on 22 May has taken it to just above the 2007 high at the 6,730 region.
That is a difference of 140 points, or just 2%. The market remembered that 2007 high as a significant level.
Now, these chart levels cannot be deduced from the fundamentals. Poring over GDP data, imports/exports, the value of the pound, housing trends and so on, will never lead you to forecast that the market will encounter heavy resistance in the region of the 2007 high!
From that May top the market declined sharply to chart support just above the 6,000 level.
This action supports my contention that the FTSE kept the memory of that 2007 high all those years. And since then, history has repeated, and the market has swung in large moves which are getting tighter.
This market is acting like a coiled spring. The next move should be far and fast.
Which way will it break?
One other thing we can do is find relevant tramlines.
Here are mine:
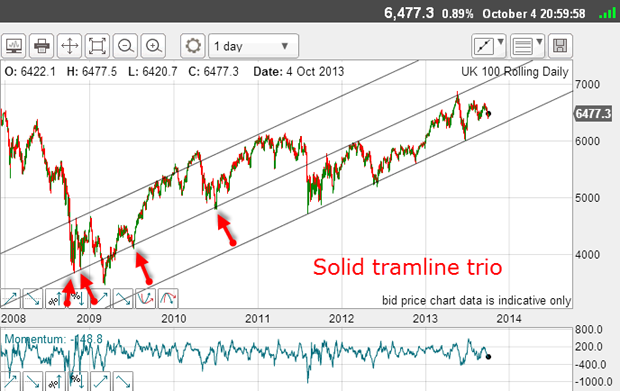
I started with the centre tramline and right away, I have several excellent prior pivot points (PPPs), thus making this line greatly significant as a line of support or resistance.
My lowest tramline is also excellent. It has several touch points, and my highest tramline has good touch points as well as a couple of overshoots.
All in all, I have great confidence in these tramlines, and until proven otherwise the market will continue to trade between the centre and lowest lines.
But I would consider a break of either one very important and probably very tradable.
Adding Elliott waves to the mix
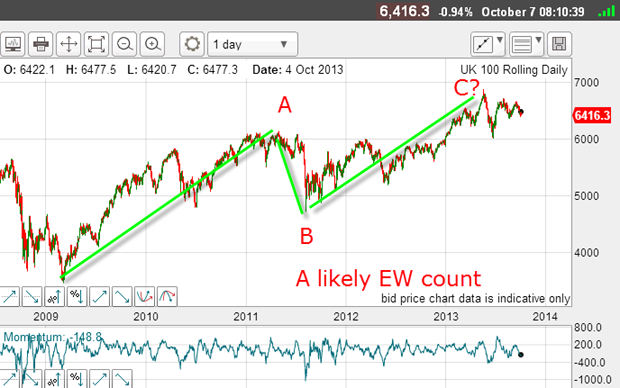
The A-B-C waves are prominent, suggesting that if I have my C wave top in place, the next big move is down. That means we should be better off trading from the short side and shorting rallies.
That is another great piece of information you can glean just from a quick glance at the chart.
Ideally, when in a C wave, I like to see a smaller-scale five-wave pattern up. If I can detect this, I have more confidence in forecasting that the next down move has started.
So let's zoom in ever closer. Here is the daily chart from the August 2012 low:
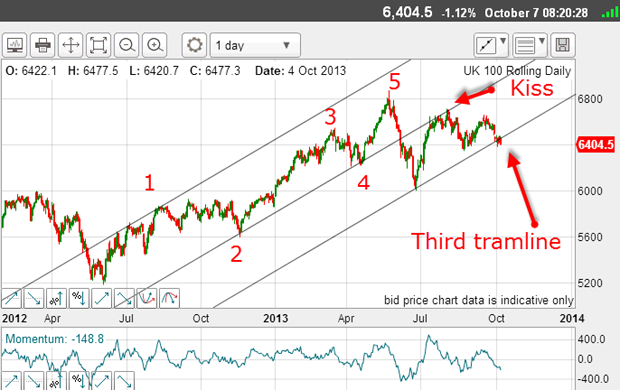
This chart contains a wealth of valuable information.
I have a solid Elliott wave count of the rally containing five waves. Then, drawing a line joining the wave 2 and wave 4 lows which is Elliott's rule for determining the correct trading channel I have my centre tramline.
My upper tramline is drawn across the wave 1 highs and has a small PPP. I can then draw in my third and lowest tramline.
Note how the sharp break off the wave 5 top was turned around precisely on this third tramline. Short-term traders had an ideal target right on this line.
Then the market rallied right to the underside of my centre tramline in a textbook kiss, and then entered the traditional scalded cat bounce down.
That was another trading opportunity.
This morning, the market is challenging this line again and appears ready to break it.
So let's zoom in even closer on the hourly chart:
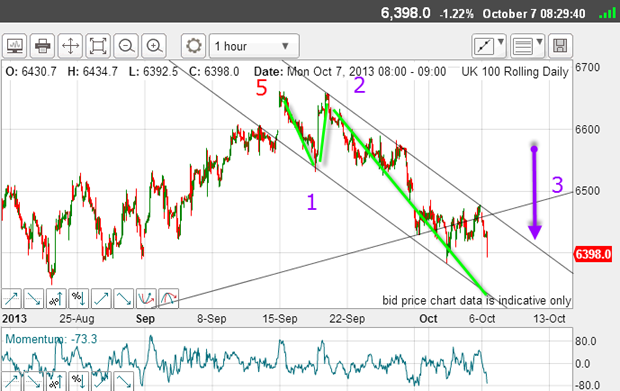
I have a good down-sloping tramline pair which the market hit on Friday (in a pretty A-B-C correction!), but the hard down move this morning is indicating we are in a wave 3. We're perilously close to chart support in the 6,350 level the previous major low on 22 August.
The market is breaking clear of the up-sloping third tramline, and that is bearish action.
Wedge pattern
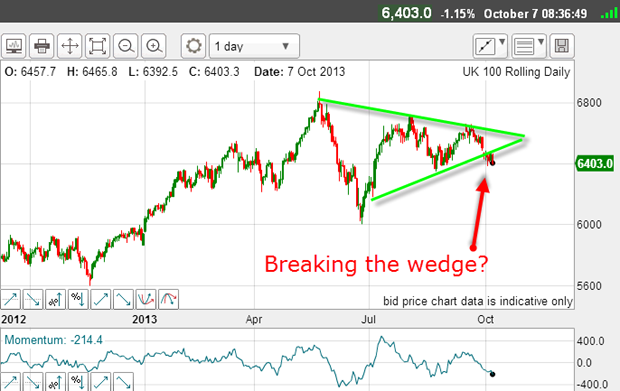
The pattern I mentioned at the start of contracting swings is a classic wedge.
This pattern is typical when, after a long bull run, the bulls are starting to doubt the rationale for their stance, and the bears are coming out of hibernation and feeling bolder.
And the drama surrounding the US government shutdown and debt ceiling deadline is weighing on the market which could provide the perfect excuse for the coiled spring to be unleashed!
Get the latest financial news, insights and expert analysis from our award-winning MoneyWeek team, to help you understand what really matters when it comes to your finances.
John is is a British-born lapsed PhD physicist, who previously worked for Nasa on the Mars exploration team. He is a former commodity trading advisor with the US Commodities Futures Trading Commission, and worked in a boutique futures house in California in the 1980s.
He was a partner in one of the first futures newsletter advisory services, based in Washington DC, specialising in pork bellies and currencies. John is primarily a chart-reading trader, having cut his trading teeth in the days before PCs.
As well as his work in the financial world, he has launched, run and sold several 'real' businesses producing 'real' products.
-
 Average UK house price reaches £300,000 for first time, Halifax says
While the average house price has topped £300k, regional disparities still remain, Halifax finds.
-
 Barings Emerging Europe trust bounces back from Russia woes
Barings Emerging Europe trust has added the Middle East and Africa to its mandate, delivering a strong recovery, says Max King