The Dow heads lower with Fibonacci bounces
These are not normal times for the world's stock markets. And something big could be happening in the Dow Jones. John C Burford looks to the charts for clues.
Get the latest financial news, insights and expert analysis from our award-winning MoneyWeek team, to help you understand what really matters when it comes to your finances.
You are now subscribed
Your newsletter sign-up was successful
Want to add more newsletters?

Twice daily
MoneyWeek
Get the latest financial news, insights and expert analysis from our award-winning MoneyWeek team, to help you understand what really matters when it comes to your finances.

Four times a week
Look After My Bills
Sign up to our free money-saving newsletter, filled with the latest news and expert advice to help you find the best tips and deals for managing your bills. Start saving today!
I don't normally write to you two days on the trot. But these are not normal times!
I think something big could be happening.
So today, I have a short extra article to follow up on yesterday's article on the dramatic moves in the Dow.
MoneyWeek
Subscribe to MoneyWeek today and get your first six magazine issues absolutely FREE

Sign up to Money Morning
Don't miss the latest investment and personal finances news, market analysis, plus money-saving tips with our free twice-daily newsletter
Don't miss the latest investment and personal finances news, market analysis, plus money-saving tips with our free twice-daily newsletter
These moves have been following the textbook pretty much to a T.
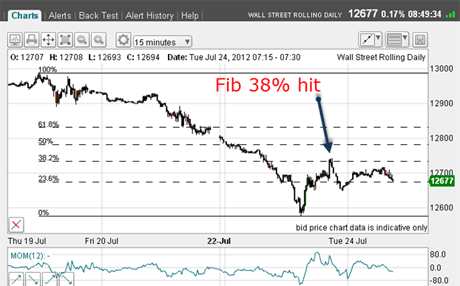
In this morning's chart on the 15-minute scale (see below), we had the huge plunge down to the sub-12,600 level, where the market became very short-term oversold.
Then, later in the day, we had the relief rally taking it right up to the Fibonacci 38% retrace of the big move down from last Thursday's high.

(Click on the chart for a larger version)
And the market now appears to be resuming the downtrend.
In other words, that rally top at the 12,740 level was another opportunity to get short for a low-risk entry.
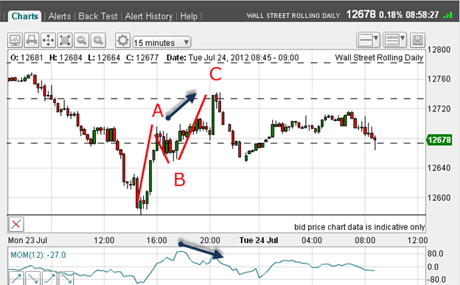
Here's the rally in close-up:

(Click on the chart for a larger version)
See how the rally has a clear A-B-C form, indicating a counter-trend move, and not a new bull move.
Also, we have a superb negative momentum divergence between the A and C wave highs (green arrows).
That was another reason to suggest the rally was petering out at the 12,740 area.
Of course, nothing is certain. The option exists for the market to move above the C wave high. If this occurs, I would be looking for a larger A-B-C form and for the rally to turn at possibly the Fibonacci 50% level in the 12,780 area.
Remember, this is not a trade recommendation. But by following real-time examples such as this, I hope to show how you can use my methods for high-probability, low-risk trading.
If you wish to reach a higher level in your own trading, make sure you grab the chance to get a seat at my next workshop details very soon.
If you're a new reader, or need a reminder about some of the methods I refer to in my trades, then do have a look at my introductory videos:
The essentials of tramline trading
An introduction to Elliott wave theory
Advanced trading with Elliott waves
Don't miss my next trading insight. To receive all my spread betting blog posts by email, as soon as I've written them, just sign up here .
Get the latest financial news, insights and expert analysis from our award-winning MoneyWeek team, to help you understand what really matters when it comes to your finances.
John is is a British-born lapsed PhD physicist, who previously worked for Nasa on the Mars exploration team. He is a former commodity trading advisor with the US Commodities Futures Trading Commission, and worked in a boutique futures house in California in the 1980s.
He was a partner in one of the first futures newsletter advisory services, based in Washington DC, specialising in pork bellies and currencies. John is primarily a chart-reading trader, having cut his trading teeth in the days before PCs.
As well as his work in the financial world, he has launched, run and sold several 'real' businesses producing 'real' products.
-
 Average UK house price reaches £300,000 for first time, Halifax says
While the average house price has topped £300k, regional disparities still remain, Halifax finds.
-
 Barings Emerging Europe trust bounces back from Russia woes
Barings Emerging Europe trust has added the Middle East and Africa to its mandate, delivering a strong recovery, says Max King