Get the latest financial news, insights and expert analysis from our award-winning MoneyWeek team, to help you understand what really matters when it comes to your finances.
You are now subscribed
Your newsletter sign-up was successful
Want to add more newsletters?

Twice daily
MoneyWeek
Get the latest financial news, insights and expert analysis from our award-winning MoneyWeek team, to help you understand what really matters when it comes to your finances.

Four times a week
Look After My Bills
Sign up to our free money-saving newsletter, filled with the latest news and expert advice to help you find the best tips and deals for managing your bills. Start saving today!
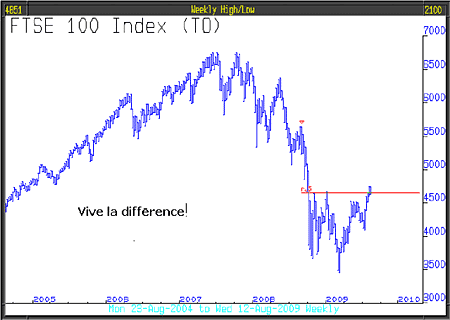
Here's an interesting question: "What does a chart for a bear market that has morphed into a bull market look like in its early stages?" Here's another interesting question: "What does a chart for a bear market rally look like?" Below is the weekly chart for FTSE that's what both of them look like. Tricky, isn't it?

The majority of commentators, analysts and investors believe the bear market is over and economic recovery is underway; in other words, complacency and excessive optimism rule. We need to look around see if we can find some clues.
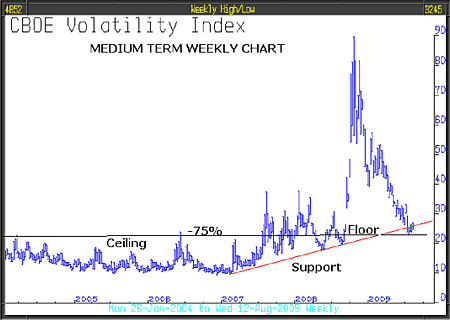
One way of measuring the sustainability of today's sentiment is to study the CBOE Volatility Index (VIX) the "fear index". Looking at the medium term weekly chart, it can be seen that the collapse, as fear abated, stalled at minus 75%. That level had previously acted as a ceiling; it was not exceeded to the upside at any time from January 2004 until July 2007, when the two Bear Stearns hedge funds went belly up.
MoneyWeek
Subscribe to MoneyWeek today and get your first six magazine issues absolutely FREE

Sign up to Money Morning
Don't miss the latest investment and personal finances news, market analysis, plus money-saving tips with our free twice-daily newsletter
Don't miss the latest investment and personal finances news, market analysis, plus money-saving tips with our free twice-daily newsletter
Has the ceiling now become the floor? From 2007 until the middle of 2008 the index vacillated above and below it. For the last five or six weeks that floor has held good. You will also see that from early 2007, the underlying trend/support and the most recent low has held. If this were a stock, we would find this chart very interesting and consider buying it on any early short term signal.

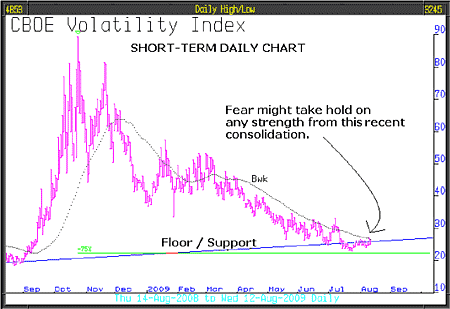
Having come to the decision to watch for an early buy signal, we close in on the daily chart. Here we can see how, in May and June this year, the speed of descent slowed and if anything, has stabilised; since the middle of July the index has ticked up modestly. This is what turning points look like. Any strength from here would be a buy signal for the VIX or should we say, a warning of a new escalation of fear!

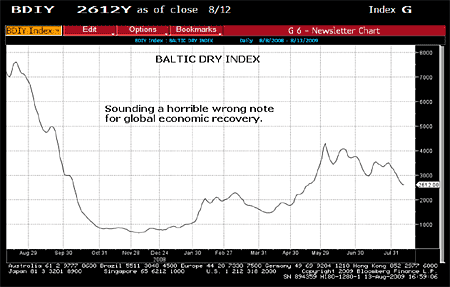
We said recently that, for reasons including the Baltic Dry Index, we had sold both our China investment and base metal investment, we are quite happy about that and have banked some decent profits. The main driver of that decision was the extraordinary breakdown of the Baltic Dry Index. At a time when green shoots are emerging and global recovery is eagerly anticipated, the Baltic Dry (shipping freight costs) broke down. It has since deteriorated further.

It's difficult for us to believe that if economic recovery is underway and if China's demand for raw materials is as dramatic as has been reported, that this index would retreat.
If, in addition to the Baltic Dry Index breaking down, the VIX breaks up, that would lead us to believe that the bear market was very close to resuming.
We would refer you to Paul Marston's "Insight" article in the FT dated 13th August. It's a long article and we can only pick from it the essential flavour, he said:
"The cloud of euphoria that followed recent results had more to do with the extraordinary low expectations than to any meaningful and lasting improvement in prospects, which still require rapid recovery and economic activity... This suggests the recent rally off the back of better than expected second quarter earnings is overdone."
And about those results. He explained that although every quarter US companies publish their results under the defined US GAAP accounting rules, which are labelled "reported earnings", that the most commonly looked at form of earnings are adjusted "operating earnings" on which companies prefer to focus.
Today, the recently announced second quarter "reported earnings" per share of the S&P companies was $7.2 down 91% from the 2007 peak. On an adjusted "operating earnings" basis they were $61.2 down only 34% from the 2007 peak. This $54 gap is a record. Make of that what you will.
Capita Registrars say that in the first six months UK FTSE companies cut dividends 9% compared to 2008 and, for the first time in living memory, by a margin of £23 billion, raised more capital than dividends paid. More was raised in those six months than for the whole period between 2003 and 2007, but that, you will remember, was when "deranged" companies were on a borrowing spree to buy back very expensive equity.
This current behaviour suggests extreme caution as boards of directors do not cut dividends lightly. We have delayed taking action on a reduction in our bear note holding. Although our levels have been modestly exceeded, the range day-to-day over the last week or so has been very narrow. However, we will seriously consider, on further FTSE strength, halving it.
A Japan stock market buy opportunity has emerged, so a decision was made to add an 8% holding to the model portfolio. Japan, as with China, is potentially a long term investment opportunity, although we have recently sold the China position. This, in a sense, replaces it and returns the model portfolio to a more balanced structure.
This article was written by Full Circle Asset Management, and was published in the threesixty newsletter on 14 August 2009
Get the latest financial news, insights and expert analysis from our award-winning MoneyWeek team, to help you understand what really matters when it comes to your finances.
MoneyWeek is written by a team of experienced and award-winning journalists, plus expert columnists. As well as daily digital news and features, MoneyWeek also publishes a weekly magazine, covering investing and personal finance. From share tips, pensions, gold to practical investment tips - we provide a round-up to help you make money and keep it.
-
 How should a good Catholic invest? Like the Vatican’s new stock index, it seems
The Vatican Bank has launched its first-ever stock index, championing companies that align with “Catholic principles”. But how well would it perform?
-
 The most single-friendly areas to buy a property
There can be a single premium when it comes to getting on the property ladder but Zoopla has identified parts of the UK that remain affordable if you aren’t coupled-up

