The charts that matter: Apple tumbles, US jobs boom
Apple’s profit warning is an unnerving sign for investors that times are changing. John Stepek looks at what’s changed in the global economy’s most important charts.

Get the latest financial news, insights and expert analysis from our award-winning MoneyWeek team, to help you understand what really matters when it comes to your finances.
You are now subscribed
Your newsletter sign-up was successful
Want to add more newsletters?

Twice daily
MoneyWeek
Get the latest financial news, insights and expert analysis from our award-winning MoneyWeek team, to help you understand what really matters when it comes to your finances.

Four times a week
Look After My Bills
Sign up to our free money-saving newsletter, filled with the latest news and expert advice to help you find the best tips and deals for managing your bills. Start saving today!
This is our first chart round up of the year, so for those of you who haven't caught up yet on Money Morning this week happy new year! Hope you had a relaxing break over Christmas and didn't spend it watching your portfolio swing around wildly.
I'm serious about that, by the way. Unless you're a day trader (which is an occupation with a stunningly short average life expectancy, metaphorically speaking), you shouldn't be looking at your portfolio that often.
If you have a long-term plan and you're sticking to it, you don't need to be checking up every day or even every week.
MoneyWeek
Subscribe to MoneyWeek today and get your first six magazine issues absolutely FREE

Sign up to Money Morning
Don't miss the latest investment and personal finances news, market analysis, plus money-saving tips with our free twice-daily newsletter
Don't miss the latest investment and personal finances news, market analysis, plus money-saving tips with our free twice-daily newsletter
And if you don't have a long-term plan? Well, the midst of a stockmarket panic is not the best time to formulate one.
Anyway no new podcast as yet this year, but if you missed the one on Gift Aid at the end of last year, you should listen to it start the year with a dose of lateral thinking common sense from Merryn.
If you missed any of this (short) week's Money Mornings, here are the links you need.
Monday: Five of the best books I read in 2018
Wednesday: 2018 was a bad year for investors, for pretty obvious reasons
Thursday: Why Apple's sales warning has rattled the currency markets
Friday: Here's why we could see an inflation "sonic boom" in 2019
And sign up now for the first issue of MoneyWeek of 2019, out on 11 January. Subscribe now!
And now... over to the charts.
The two big surprises this week were Apple warning on sales and the US coming out with an exceptionally strong employment report for the month of December. More on both of those further down.
But overall, it creates a quandary for the Federal Reserve. On the one hand, Apple's warning is another unnerving sign for investors that times are changing weakness in the Chinese economy in particular could make life harder for everyone. So investors were probably hoping for a hint of support from the Fed at this point.
Yet the huge gains in employment seen in December make the odds of a Fed pause much lower than they were previously. It also suggests that any hope of a turnaround in the strong dollar (a weaker dollar should typically mean stronger markets in general) might be dashed for now.
Anyway, that's the backdrop. What are the charts telling us? What's been clear over the last fortnight or so is that markets have been growing increasingly jittery about recession prospects. What'll be interesting to watch for the next month or so is how the signs of strength in the US jobs report affect that view.
First, the yield curve (here's a reminder of what it is, should you need it). The chart shows the difference (the "spread") between what it costs the US government to borrow money over ten years rather than two. Once this number turns negative , the yield curve has inverted which almost always signals a recession (although perhaps not for up to two years).
The spread has clawed its way back from the brink and it'll be interesting to see how that strong US jobs report affects it over the next few weeks. Will investors interpret this as a sign of strong growth, stop panicking about recession, and start to drive the curve back to normal levels? Or will they just assume that it makes the Fed far more likely to tighten "too much" and cause a recession?
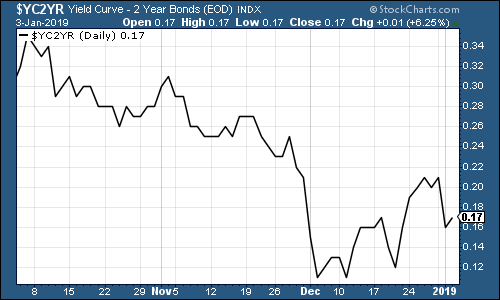
(The gap between the yield on the ten-year US Treasury and that on the two-year: going back three months)
And how about gold (measured in dollar terms)? The yellow metal has been on a tear in recent weeks as investors panicked and ran for the perceived safety of precious metals. But (and you can't see this on the chart below as it only goes up to the close on Thursday) the jobs report knocked the wind from gold's sails somewhat on Friday.
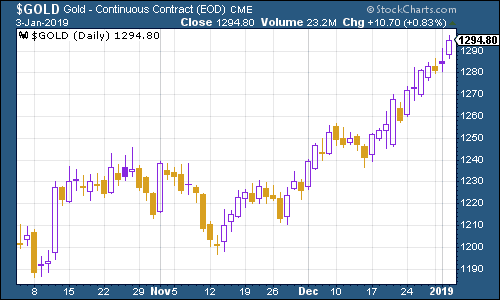
(Gold: three months)
The US dollar index a measure of the strength of the dollar against a basket of the currencies of its major trading partners was broadly flat during the last two weeks, but it certainly liked the jobs report.
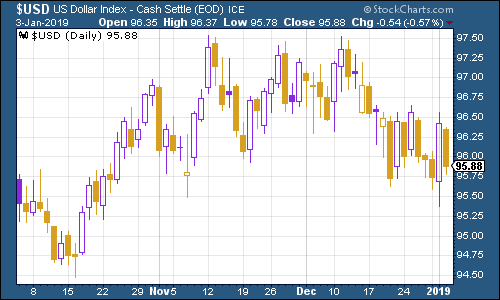
(DXY: three months)
The ten-year US Treasury bond yield remained well below 3%, but again it spiked higher as the jobs report came out.
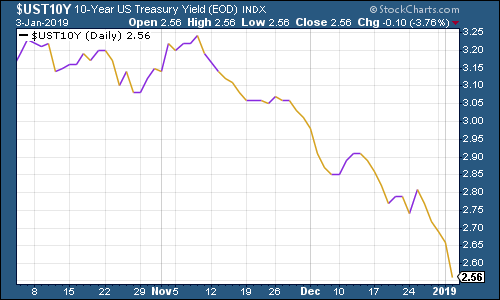
(Ten-year US Treasury yield: three months)
The Japanese government bond (JGB) yield hit zero again over the Christmas period. Unless risk appetite improves soon, it could easily go negative again.
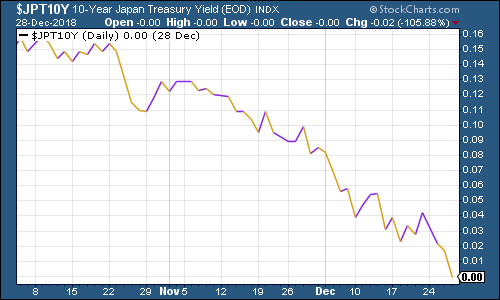
(Ten-year Japanese government bond yield: three months)
Ten-year German bund yields (the borrowing cost of Germany's government, Europe's "risk-free" rate) have been on the slide too they are not far off Japanese levels themselves now. While yields on US debt will have some bearing on both forms of government debt, China's economic outlook is arguably a lot more important for both nations in terms of trade prospects.
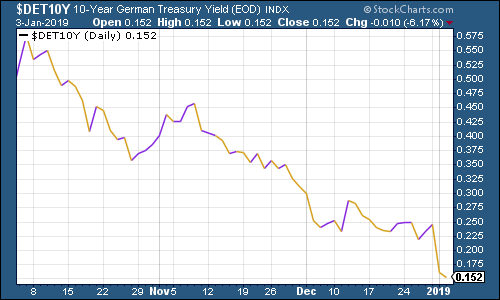
(Ten-year bund yield: three months)
On that note, copper finally dived below the $2.70 mark it had been valiantly clinging to over the Christmas period again, a classic sign of recession fear and also an indicator of Chinese economic health.
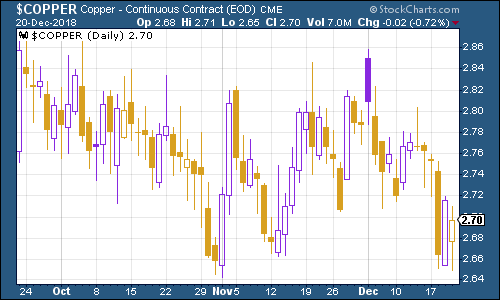
(Copper: three months)
And staying on China, I've decided to add a new chart this week the Aussie dollar. It's probably the best indicator of how investors are feeling about the Chinese economy. Generally, if investors feel glum about China, they'll see the Australian dollar. (It doesn't help that the Australian housing market is falling off a cliff, but it's a good sentiment indicator even so).
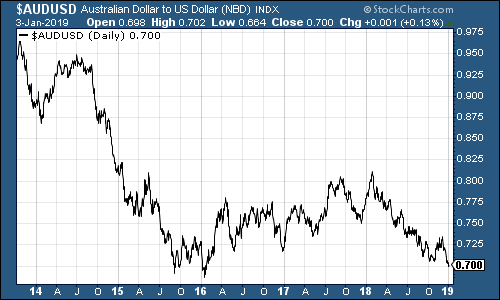
Cryptocurrency bitcoin is nothing short of hilarious. While every other asset in the world was crashing (stocks) or soaring (gold and bonds), the most volatile asset of 2018 did almost nothing.
Just fascinating.
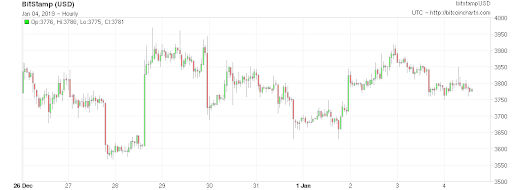
(Bitcoin: ten days)
Now let's look at the US employment picture in more detail. First, let's go to our usual indicator the four-week moving average of weekly US jobless claims. This week it dipped to 218,750, as weekly claims came in at 231,000. The next few weeks are likely to be distorted by the government shutdown however.
David Rosenberg of Gluskin Sheff has noted in the past that US stocks typically don't peak until after we've seen jobless claims (as measured by the four-week moving average) hit rock bottom for a cycle. On average, the peak follows about 14 weeks from the trough. A recession follows about a year later. (But remember that this is taken from a small sample size with a lot of variation).
You can see the most recent trough in the chart below it was on September 15th. That would suggest that the stock market may already have peaked, and would imply a recession late this year or in 2020.
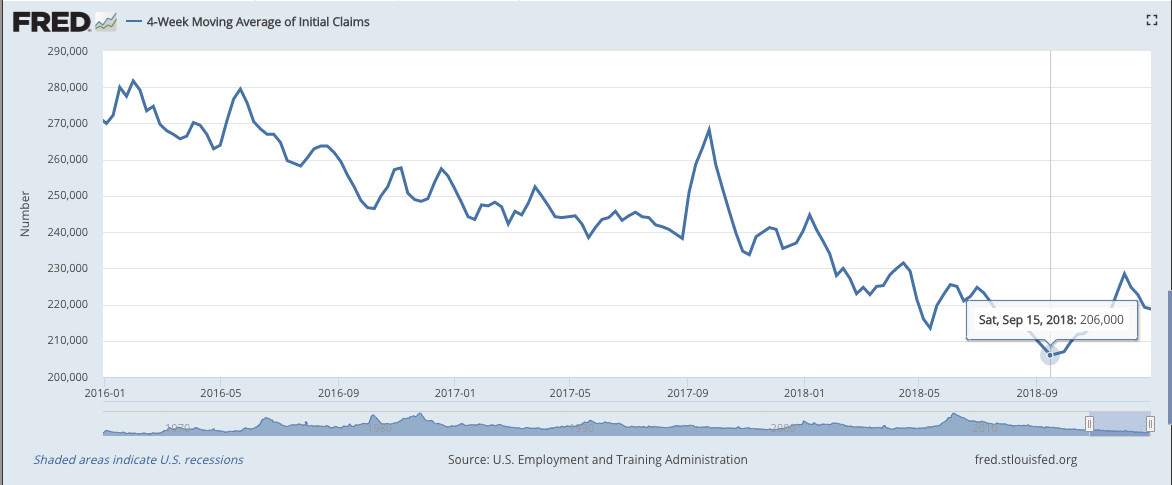
(US jobless claims, four-week moving average: since January 2016)
Yet given the strength of the latest jobs report, is this likely? For me, the jury is out.
Markets expected the nonfarm payrolls data to show that the US added 177,000 jobs in December. Instead, a whopping 312,000 jobs were added, and not only that, but the number of jobs added in November was revised higher by 58,000.
Meanwhile, the unemployment rate rose, from 3.7% to 3.9%. That sounds like bad news, but it's not. What it actually means is that lots of people who had, in effect, given up entirely on looking for work, have rejoined the potential workforce. So the rising unemployment rate is, in fact, good news in this context it means more people are leaving the ranks of the terminally discouraged.
And why have they done that? Because wages are finally going up. Year-on-year wage growth rose to 3.2%. That's the highest level in a decade. As Capital Economics puts it, a report this strong makes a "mockery of recession fears".
In short, this is a very strong report, and while employment is a lagging indicator (in other words, it peaks after things have already started getting bad elsewhere), it's very hard for markets or the Fed to just shrug this off. It'll certainly shape the tone of trading for the next few weeks at least, I expect.
The oil price (as measured by Brent crude, the international/European benchmark) has been picking up in the last week or so, amid news that oil cartel Opec trimmed production last month and hopes that perhaps the economic situation is not as grim as thought.
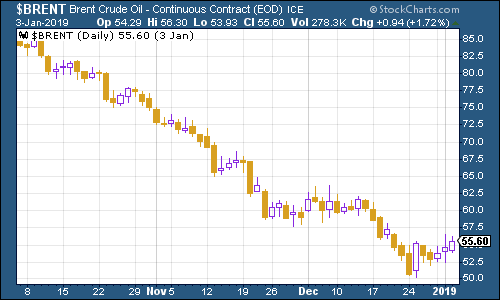
(Brent crude oil: three months)
Internet giant Amazon has continued to make lower lows over the last couple of months. Will the trend turn around? This is the core FAANG stock I'm watching right now unlike Facebook, it isn't detested for stock-specific reasons and it is still plugged into a lot of "hot" themes, such as cloud services.
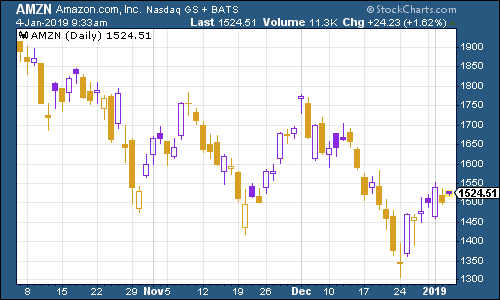
(Amazon: three months)
Electric car group Tesla fell back again this week although it has hardly been the biggest faller over the Christmas period. Tesla's big problem is that while deliveries of its cars have gone up, with subsidies for buyers being cut in the US, it's having to cut prices too.
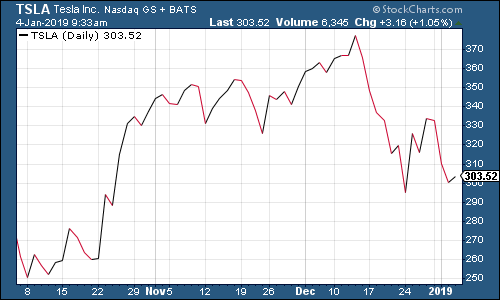
(Tesla: three months)
Get the latest financial news, insights and expert analysis from our award-winning MoneyWeek team, to help you understand what really matters when it comes to your finances.

-
 Average UK house price reaches £300,000 for first time, Halifax says
While the average house price has topped £300k, regional disparities still remain, Halifax finds.
-
 Barings Emerging Europe trust bounces back from Russia woes
Barings Emerging Europe trust has added the Middle East and Africa to its mandate, delivering a strong recovery, says Max King