Get the latest financial news, insights and expert analysis from our award-winning MoneyWeek team, to help you understand what really matters when it comes to your finances.
You are now subscribed
Your newsletter sign-up was successful
Want to add more newsletters?

Twice daily
MoneyWeek
Get the latest financial news, insights and expert analysis from our award-winning MoneyWeek team, to help you understand what really matters when it comes to your finances.

Four times a week
Look After My Bills
Sign up to our free money-saving newsletter, filled with the latest news and expert advice to help you find the best tips and deals for managing your bills. Start saving today!
Two weeks ago we reported that on Tuesday 10 March the Dow stormed ahead by 379 points, and a large consensus decided that the bear market was over and the next bull market was underway. Since then, on the back of Timothy Geithner's new initiative for dealing with the banks' legacy assets (they used to call them toxic assets) the American stock market has led the world even higher the Dow from its February low is up 22%.
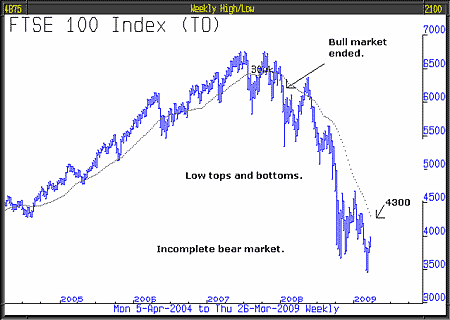
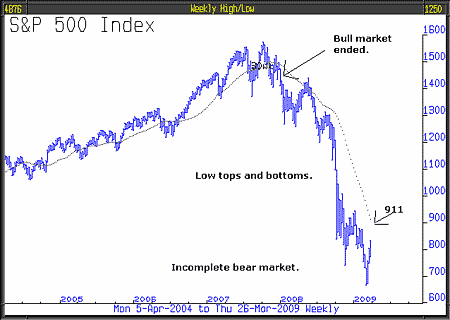
World markets, including the FTSE, have naturally benefited; the FTSE has risen 16% from its February low - all very impressive. So today we have to ask ourselves again "Has a new bull market started?" A good place to start is to look at what other historic primary bear markets looked like when they ended; we study two charts and compare them to the current charts for the S&P 500 and FTSE.
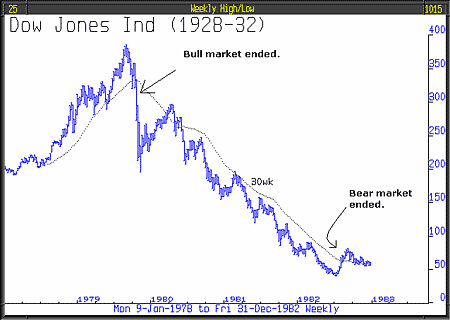
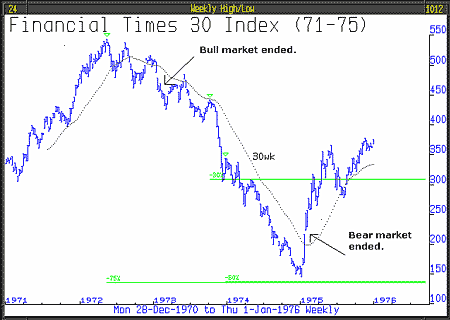
The chart for the US stock market following the 1929 crash demonstrates that there was a clear visual signal when it was appropriate to say that the bear market had ended that point is arrowed, it's where the price finally regained the area above the 30-week moving average the bear market ended then. The UK bear market of 1972 to 1975 shows the identical signal.
MoneyWeek
Subscribe to MoneyWeek today and get your first six magazine issues absolutely FREE

Sign up to Money Morning
Don't miss the latest investment and personal finances news, market analysis, plus money-saving tips with our free twice-daily newsletter
Don't miss the latest investment and personal finances news, market analysis, plus money-saving tips with our free twice-daily newsletter


The current chart for FTSE shows quite clearly that we have no signal for the end of the bear market, the 30-week moving average is at 4,300 and FTSE is still below 4,000, more importantly it has throughout its decline made lower tops and lower bottoms. We have to presume the bear market is still in place and that is our view. A similar conclusion can be reached from studying the up-to-date chart for the S&P 500.


Another area for examination is buying power and selling pressure. On the 9th March when the markets were at their recent lows, according to Lowry's statistics, the buying power index was at 96; on that same day the selling pressure index was at 899. On the 24th March, buying power was 138 but selling pressure had only eased to 883. At the end of a bear market you would expect to witness a collapse of selling pressure. This high number says that the selling pressure is still there in abundance and the slightest trigger would probably set off the next leg down of this bear market.
It always has to be remembered that the end of bear markets have never in the past been signalled by mainstream participants diving in. A few weeks ago we published the three phases of a bear market: "the third phase is caused by distress selling of sound securities, regardless of their value, by those who must find a cash market for at least a portion of their assets." Quite clearly we have not seen that.
The economist Andrew Smithers, renowned for his ability to value markets, recently wrote "The world economy is in bad shape and, when this has happened in the past, markets have become much cheaper than the US is today. We expect the US stock market to fall further this year, mainly because we expect corporate buying, which has been the main support for stock markets in recent years, to switch to corporate supply." This is a point we made previously, bizarrely the top of the stock market in 2007 was characterised by companies borrowing money and buying back very expensive equity. Now markets are significantly lower, those same companies need to repay debt, they do this by selling equity when it is relatively much cheaper.
This article was written by Full Circle Asset Management,as published in the bi-weekly threesixty Newsletter
Get the latest financial news, insights and expert analysis from our award-winning MoneyWeek team, to help you understand what really matters when it comes to your finances.
MoneyWeek is written by a team of experienced and award-winning journalists, plus expert columnists. As well as daily digital news and features, MoneyWeek also publishes a weekly magazine, covering investing and personal finance. From share tips, pensions, gold to practical investment tips - we provide a round-up to help you make money and keep it.
-
 Average UK house price reaches £300,000 for first time, Halifax says
While the average house price has topped £300k, regional disparities still remain, Halifax finds.
-
 Barings Emerging Europe trust bounces back from Russia woes
Barings Emerging Europe trust has added the Middle East and Africa to its mandate, delivering a strong recovery, says Max King

