What’s best to invest in now – stocks or houses?
Which is the better investment over time - stocks or property? Dominic Frisby attempts to answer the question once and for all.

Get the latest financial news, insights and expert analysis from our award-winning MoneyWeek team, to help you understand what really matters when it comes to your finances.
You are now subscribed
Your newsletter sign-up was successful
Want to add more newsletters?

Twice daily
MoneyWeek
Get the latest financial news, insights and expert analysis from our award-winning MoneyWeek team, to help you understand what really matters when it comes to your finances.

Four times a week
Look After My Bills
Sign up to our free money-saving newsletter, filled with the latest news and expert advice to help you find the best tips and deals for managing your bills. Start saving today!

Where should you put your money? Stocks or property?
Which is the better investment?
In today's Money Morning we settle the question once for all.
MoneyWeek
Subscribe to MoneyWeek today and get your first six magazine issues absolutely FREE

Sign up to Money Morning
Don't miss the latest investment and personal finances news, market analysis, plus money-saving tips with our free twice-daily newsletter
Don't miss the latest investment and personal finances news, market analysis, plus money-saving tips with our free twice-daily newsletter
Sort of...
A look at house prices through the prism of share prices
I'm using the All-Share rather than the FTSE 100 because there are more companies listed, and they are more domestically focused. The FTSE 100 is heavily weighted to natural resources stocks, especially miners. Also roughly three quarters of FTSE 100 company revenue is made overseas, so it's not the best gauge for our purposes here.
Comparing these two asset classes is notoriously difficult. Do we include rents and dividends? What about the capital gains tax (CGT) implications? Mortgages and leverage play a role a 10% deposit and 90% mortgage means that the house only needs to go up by 10% for you to double your money. Unless spreadbetting or similar, people tend to be less levered when trading stocks. And so on.
For our comparison we assume no leverage and no mortgage, just a straight cash investment. We ignore CGT and other taxes. And we make the dodgy assumption that rents (or the utility of a house if you're actually living in it) and dividends cancel each other.
Our starting point is 1955.
My thanks go to Nick Laird of GoldChartsRUs for cobbling together these charts. Here's the first of them.

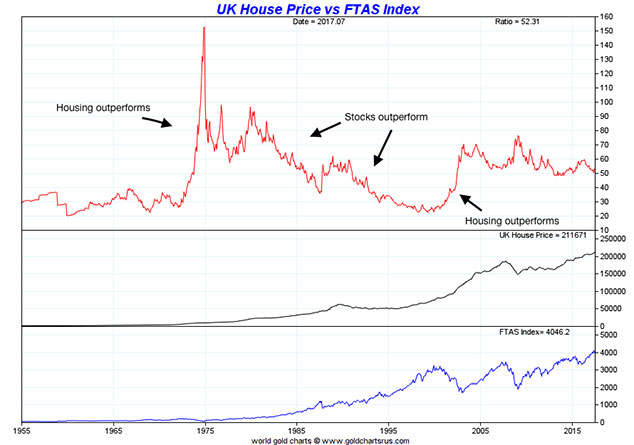
The red line in the upper pane shows the ratio between the average UK house price (according to Nationwide), and the FTSE All-Share index. When the red line is rising, housing is outperforming stocks. When it is falling, stocks are outperforming houses.
The black line in the second pane shows the average UK house price. The blue line at the bottom shows the All-Share.
Both asset classes have done well, of course, extremely well it's why Baby Boomers are so loaded. But whereas in 1955 the average UK house was 30 times the FTSE All-Share, it's now 50 times, give or take.
Housing has outperformed stocks, in other words.
However, if you were really smart, and could invest with the clarity of hindsight, while avoiding CGT, then in around 1970 you would have switched into property and remained there till 1975. Property vastly outperformed stocks in the early 1970s more than at any time in recent history with the ratio hitting 150.
We might attach the huge outperformance to the oil price shock and inflation, but surely the biggest factor was the Bank of England's deregulation of the mortgage market. This allowed high street banks no longer just building societies to lend. All that newly-created money poured into the housing market and dramatically pushed up prices.
In 1975, you would have then gone into stocks and stayed there until 2000 perhaps flipping in and out a couple of times, if you were really smart (and unhindered by taxes, transaction costs and timing issues).
You can see the huge boom in stocks with the disinflation of the 1980s and 90s, financial deregulation and so on.
Property was then the better investment from 2000 until 2009 there were two major stockmarket crashes in this period. Since the global financial crisis (GFC), stocks have outperformed.
But what about now?

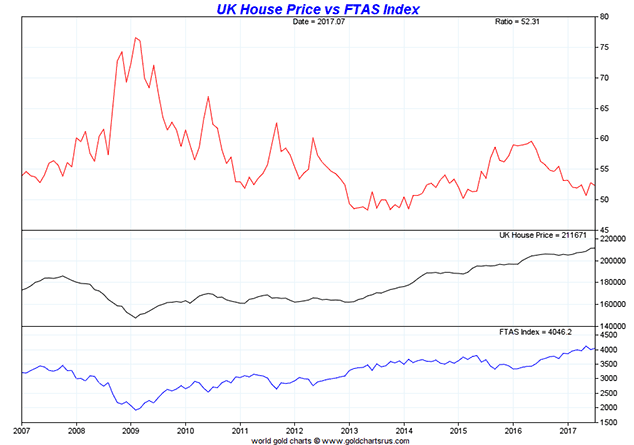
By spring 2009, in the aftermath of the great financial crisis, the average UK house was 75 times the level of the All-Share index. House prices have crept up since then (in London the story is rather different), but stocks, of course, have been in a mega bull market.
As a result, today the average house (£210,495) is around 51 times the All-Share (4,134) in other words, housing has underperformed stocks over this period. Now what's interesting is that this ratio level 50 times has historically been a turning point. It meandered around this level in the 1980s as well as in 2013.
However, if I had to stick my neck out and say which is likely to outperform over the next 10 years, I would venture that stocks will. That is the direction of the current trend, and there are all sorts of hidden forces at work the main one being unaffordability which means there is a heavier lid on house prices than when the ratio has been at this level in the past.
Equally, the long-term low of 20 times, such as we saw in the late 50s, 60s and 90s, looks unlikely but you never know.
As usual, London is the exception
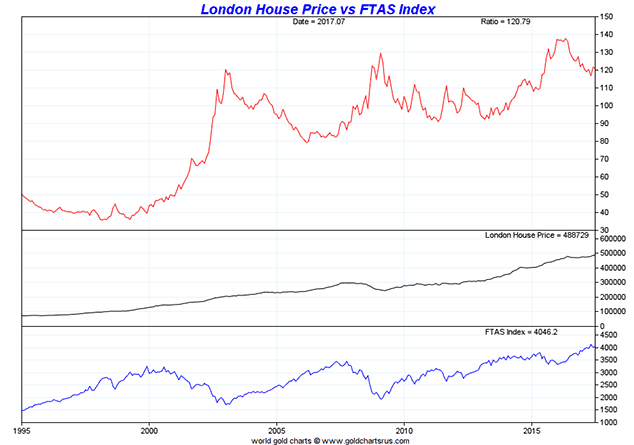
The data for London goes back to 1995.

London property has beaten the All-Share hands down with the ratio rising from under 40 times in the late 90s to around 120 times today. The long-term trend is clearly up.
However, it's worth noting that as London prices have stalled over the last couple of years, the ratio came down from 140 to 120. It's still absurdly high. While I am not as bearish on property as some, neither am I particularly bullish, so my forecast would be for that ratio to come down further, perhaps even below 100. Higher interest rates would do the trick, but that is another issue in itself.
For it to go back to 1990s levels, though, something fairly monumental would have to happen rates at 7% or 8% or something. Mind you, that might crucify stocks as well (which clearly means the ratio wouldn't necessarily fall particularly hard and might even rise, depending on which asset was hit harder by rate hikes).
Such a day seems a long way from here in the gutter at 0.25%, where even the idea of a quarter-point rise is a major issue. But one day it will happen. Perhaps the long overdue crisis in the government bond market will be the cause.
So sometimes housing beats stocks, and sometimes it's the other way round. In the current trend stocks are outperforming. Obviously, each individual stock or house is its own case in point, but my prognosis for now is that the trend will continue and stocks will beat houses over the next few years.
Get the latest financial news, insights and expert analysis from our award-winning MoneyWeek team, to help you understand what really matters when it comes to your finances.

-
 Average UK house price reaches £300,000 for first time, Halifax says
While the average house price has topped £300k, regional disparities still remain, Halifax finds.
-
 Barings Emerging Europe trust bounces back from Russia woes
Barings Emerging Europe trust has added the Middle East and Africa to its mandate, delivering a strong recovery, says Max King